Use Incidents to Investigate a Playbook
Note
The Incident Response feature is handled by the feature flag. Contact your administrator to enable this feature.
The Incident Response pages help you examine a playbook to focus on certain incident types. If you have an incoming set of alerts, you can use incident response to help you navigate step-by-step to find the source of an issue. You can zoom in on particular steps that are of most interest, such as a step that shows a result from VirusTotal. Or you can find out what happened in a particular step that caused the overall playbook results to have a high score.
With incident response, your playbook allows you to examine a set of alerts, with different views to help you explore in detail and mark identify the steps and messages that are of most interest.
Each step that you want to examine can be marked in one of the following ways:
- Source. Use this marking option to examine results as they enter a subsection of your playbook.
- Output. Use this marking option to examine results as they leave a subsection of your playbook.
- Summary. Use this marking option to examine results with a subsection of your playbook.
Viewing and Managing Incidents
To view and manage incidents, select Incident Response on the side menu. By default, New Incident Type is selected, and the New Create New Incident Type settings are shown. If some incident types are already created, they are also listed, and you can select any of them to access their details.
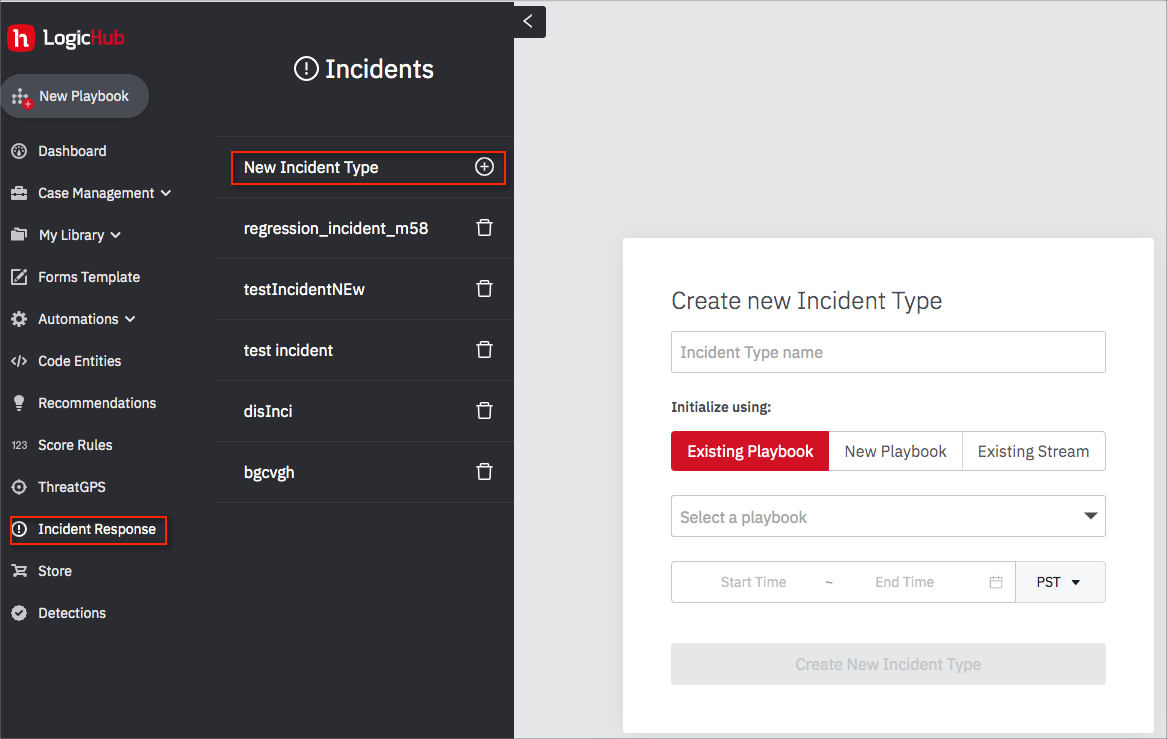
An incident type is always based on a playbook or a stream. You can create an incident type using an existing playbook, an existing stream, or a new playbook specifically for incident response. The following instructions explain how to create an incident type from an existing playbook. The process is similar when using an existing stream or a new playbook.
Create an Incident Type from an Existing Playbook
To create a new incident response type from an existing playbook:
- Open the Incident Response page to display the settings. If the settings aren't visible, click New Incident Type.
- Assign a name to identify the incident type.
- Click Existing Playbook and choose the playbook.
- Define the time range or select a predefined range.
- Click Create New Incident Type.
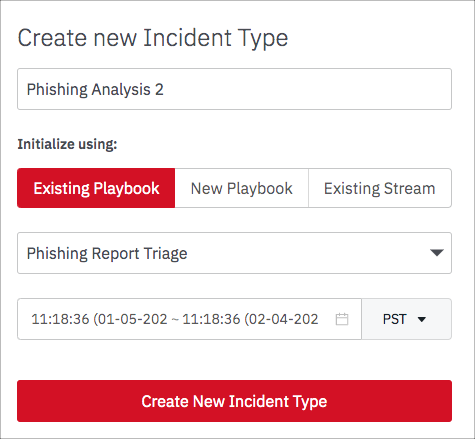
The incident type is created and the details page opens.
Marking Steps for Incident Response
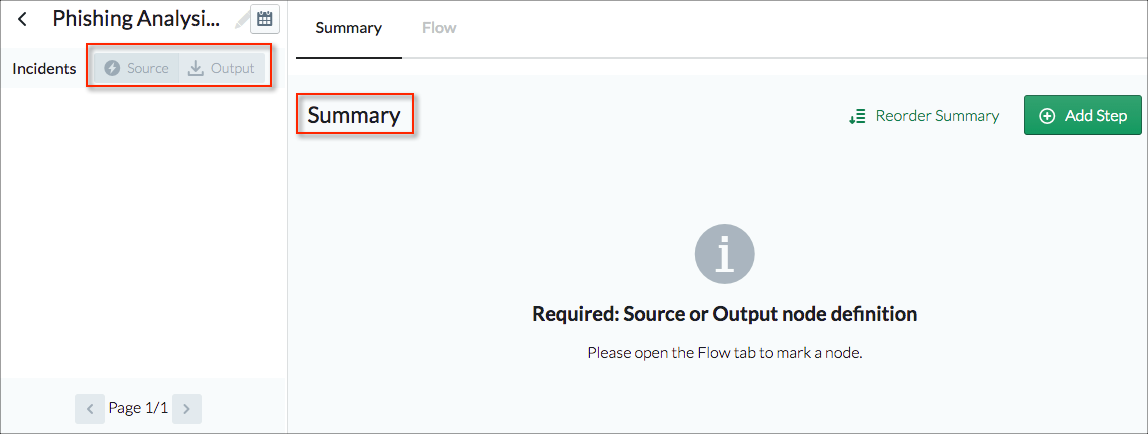
When you create an incident type from an existing playbook the details page doesn't initially report any results. But you can see how the page is structured and where the results will be reported after you edit the playbook to highlight particular steps.
The left pane has a Source and an Output tab. These report on steps that you mark as Source or Output steps in the playbook. The Summary area on the right reports on steps that you mark as Summary steps in the playbook.
Mark Steps and Report Results
Click the Playbooks tab in the right pane to edit the underlying playbook.

The playbook designer has all the features and interactions that are available from the standard playbook designer, and any changes to the design that you make here become part of the playbook.
In addition to all the usual playbook designer capabilities, the playbook designer in the incident response pages supports the following actions specifically for incident types:
- Mark as Source. Adds the results to the Source tab in the left pane.
- Mark as Summary. Adds the step to the information in the Summary tab.
- Mark as Output. Adds the results to the Output tab in the left pane.
For example, the following Phishing Analysis playbook obtains emails from an inbox where users have been sending potentially harmful or phishing emails. It takes all unread emails in the inbox and does some third party analysis on the emails, including examining any URLs, attachments, or unknown sender in the emails.
The playbook follows this process.
- Email data comes into the playbook.
- The data is sent to third party applications to analyze the email contents.
- The scores are then combined and an lhub_score is calculated.
- The results are then separated into low, medium, high, and critical scores.
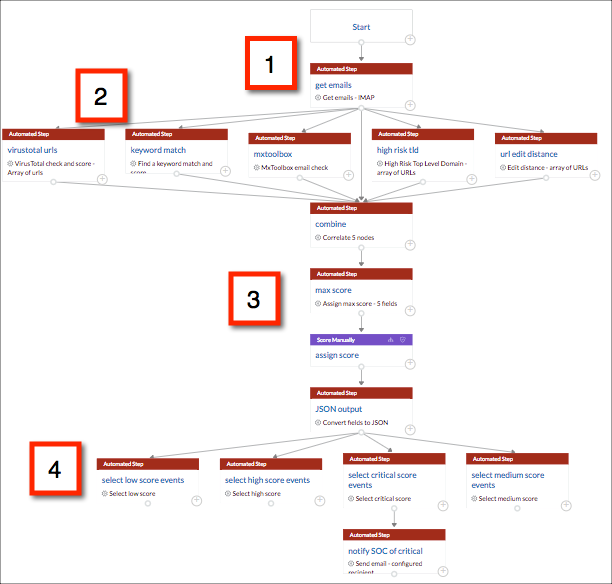
The following example steps show how steps in the playbook were marked to focus in on the critical scores from the analysis.
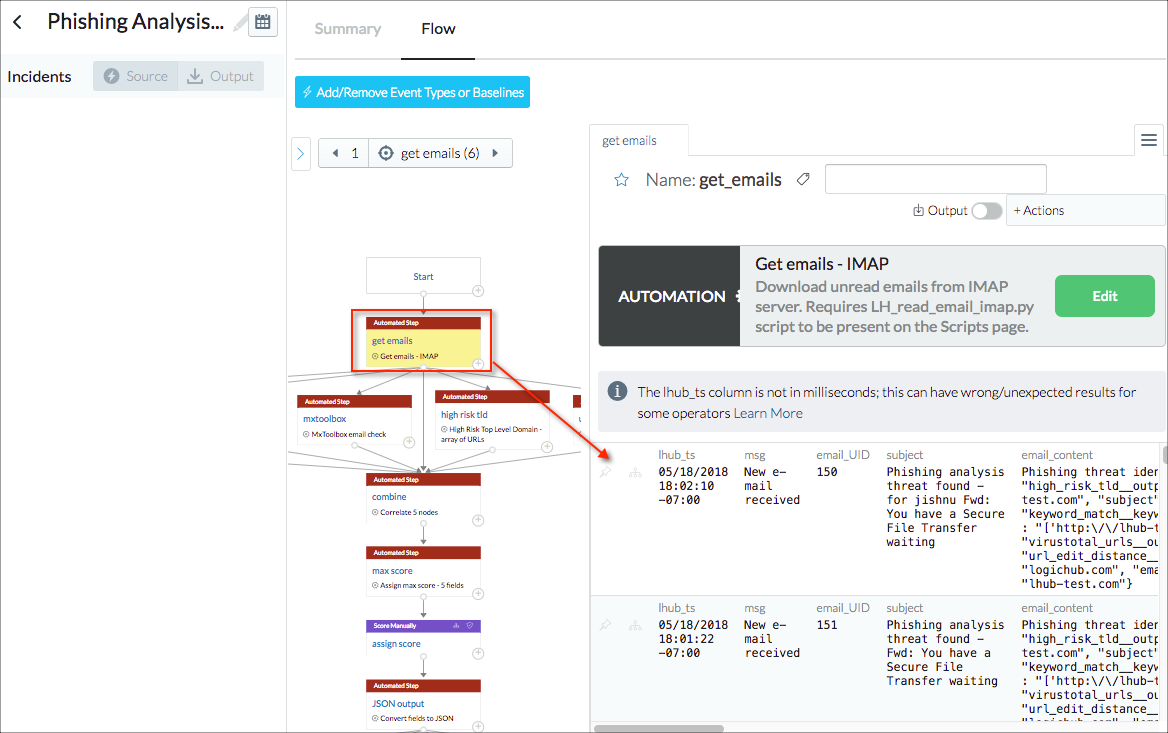
- The step where data enters the playbook was selected.
Note
When you select a step in an incident type playbook, first verify that you can see results in the results table. If you cannot, modify your data range or make other changes as needed before continuing.
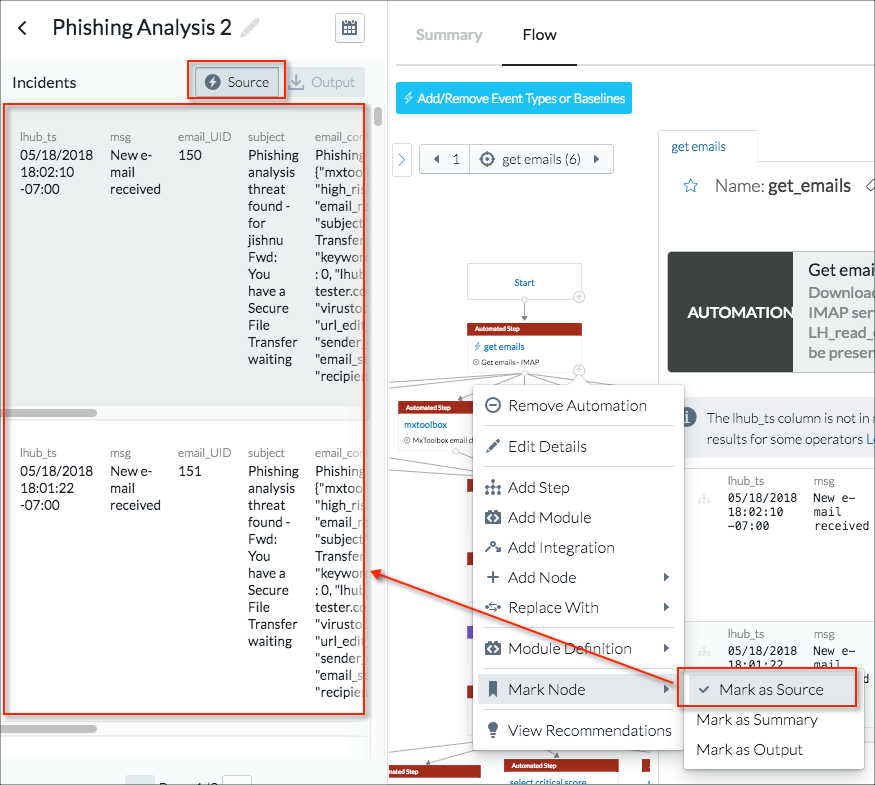
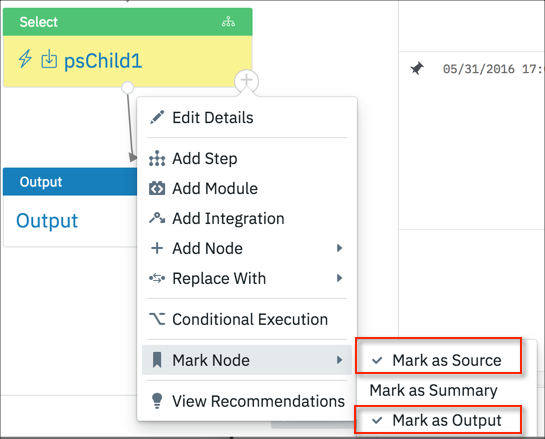
- To mark the step as the source step, + > Mark Nodes > Mark as Source was selected. The Source tab on the left was updated immediately with the results from the step marking.
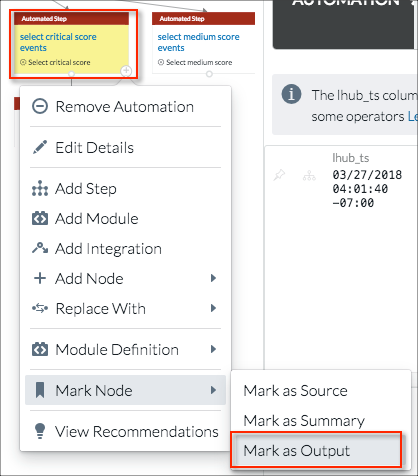
- To mark the step with the critical score results as the output for the incident analysis, + > Mark Nodes > Mark as Output was selected.
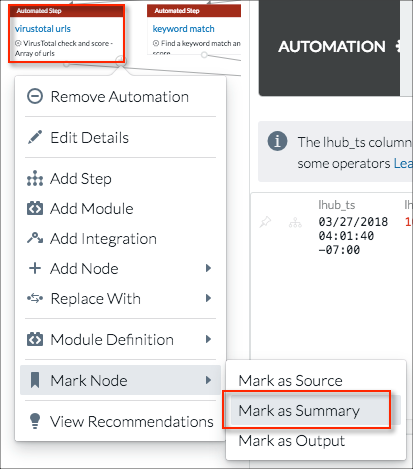
- The third type of step marking is Summary. Marking a step as Summary allows you to examine aspects of the processing that takes place between the source and output steps. In this example, assume that the analyst is particularly interested in the result that VirusTotal contributed to the critical scoring. + > Mark Nodes > Mark as Summary is selected for the VirusTotal urls step.
You can mark more than one step as a summary step. For example, if URL distance is also an issue, the url edit distance step can also be marked as a summary step.
Note
When a step is marked, an icon is displayed to the left of the step name.
With these markings in place, the Summary tab on the incident details page displays the results of all the markings.
How to Use the Incident Details Page
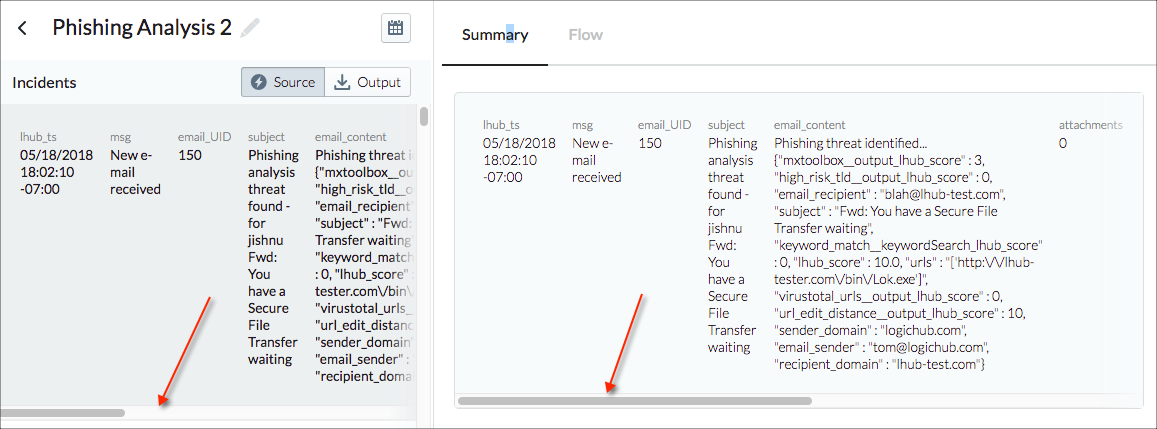
Scrollbar
Each table entry on the page has its own horizontal scrollbar so you can see all the columns of data for that entry.
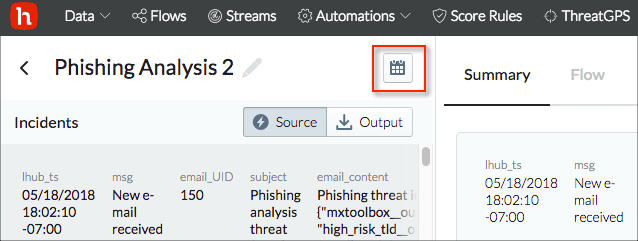
Date Range
Use the calendar control at the top of the details page to set the date range.
Left Pane
The left pane contains the individual results from the marked step. The results are divided into source and output results, which are shown on separate tabs.
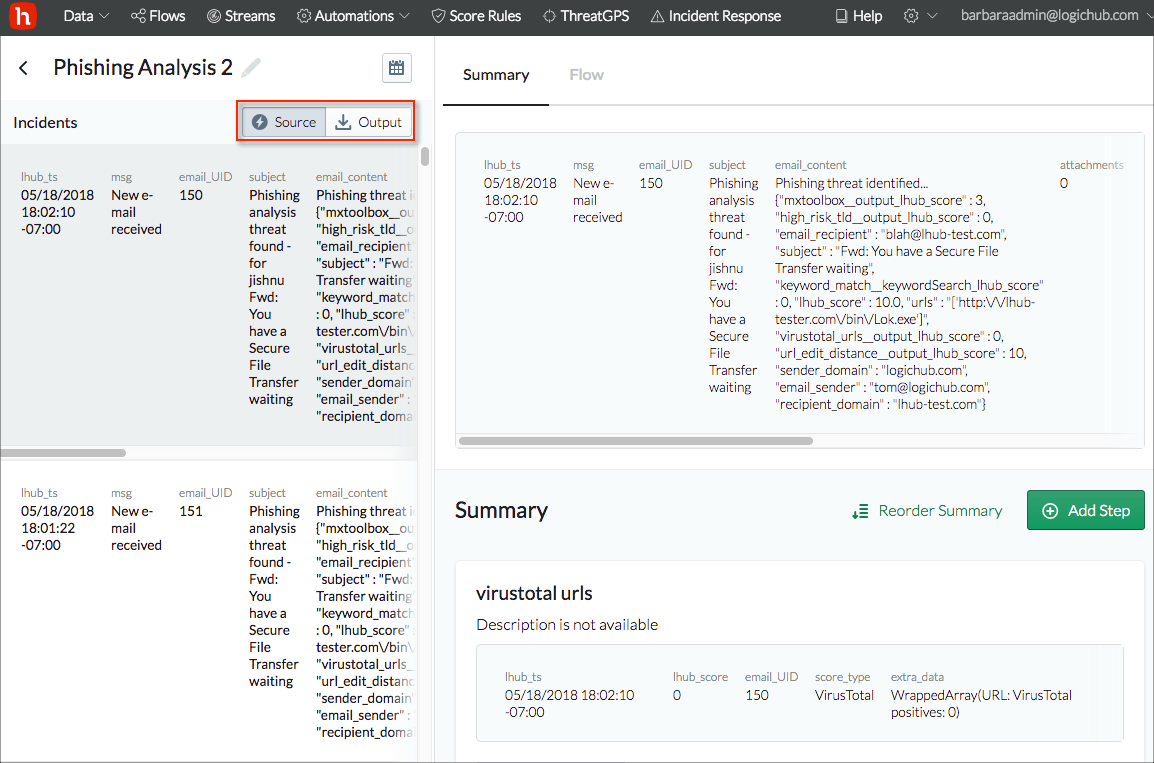
Notes about the Source and Output Tabs:
- If you use an existing playbook to create your incident type, the Source and Output tabs are empty until steps are marked in the playbook designer.
- If you create an incident type using a new playbook, all the steps are listed as source steps by default. If you mark any as output steps in the playbook designer, the Output tab becomes active and displays the results table for that step.
'Displaying score and description results' at the end of this topic explains how you can modify the source or output results to show color-coded score results and descriptions.
Right Pane
The right pane includes the Summary tab and Playbooks tab.
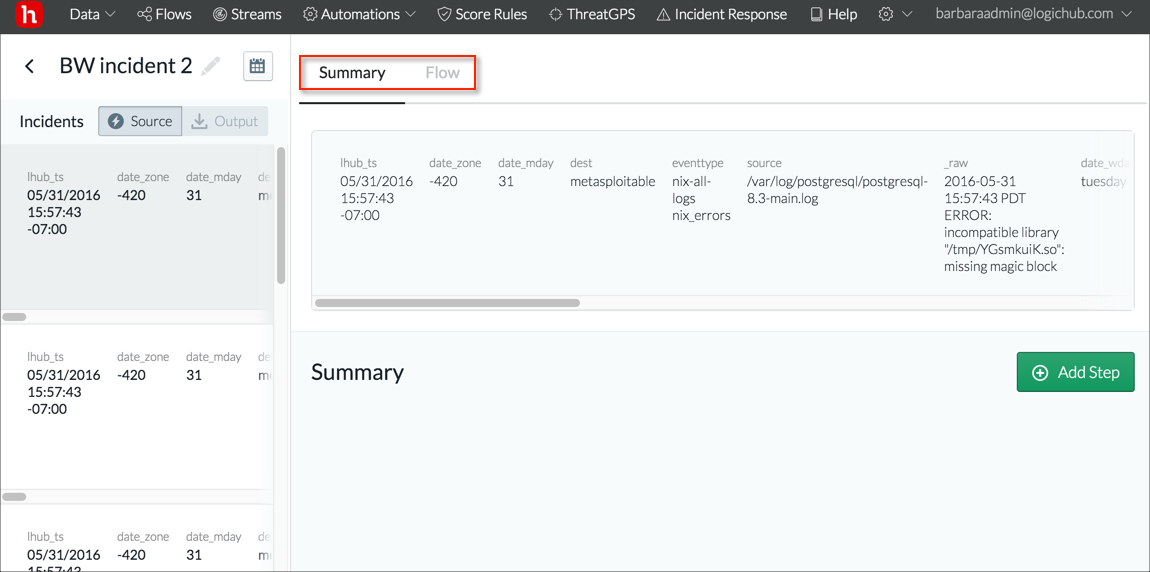
Summary Tab
The top of the Summary tab shows the results for the row that is selected on the left.
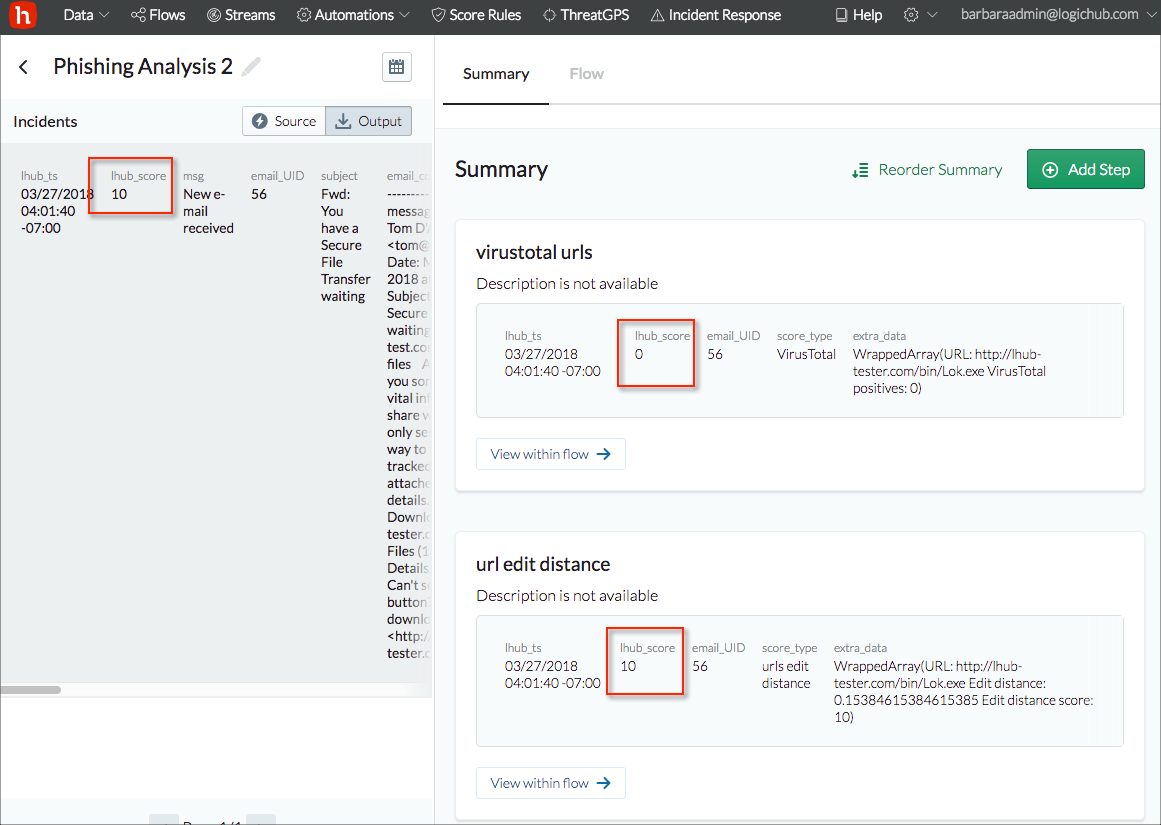
Below the top row the tab presents information on how the steps that are marked as summary steps in the playbook contributed to the result in the top row. For the phishing example, the Output tab lists the results that were marked critical (lhub_score of 10). But which of the third party analysis tools provided that result? You can see by examining the Summary tab. VirusTotal didn't consider the result to be a threat (lhub_score 0), but the URL distance analysis identified the critical issue (lhub_score 10).
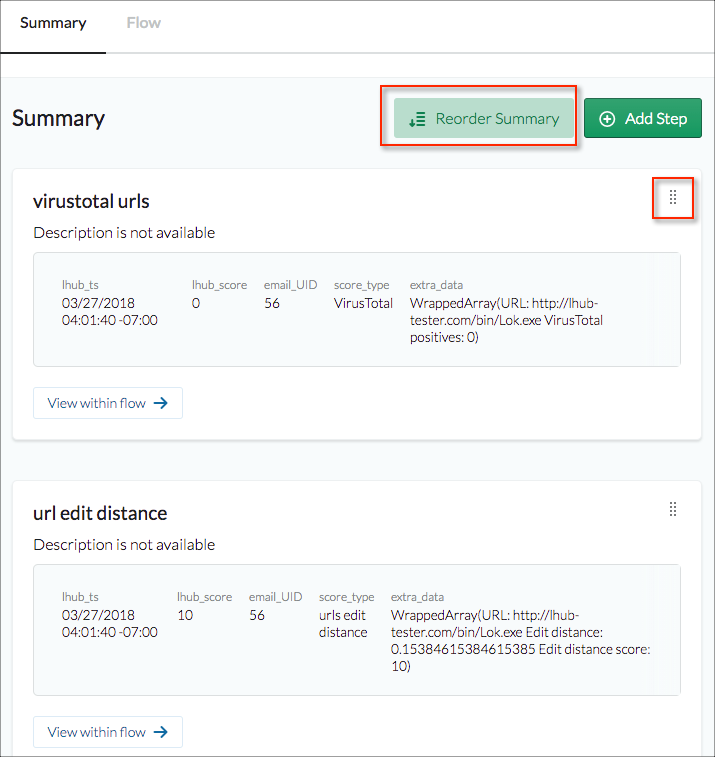
If you have multiple steps marked as Summary in your playbook, you can reorder the results by clicking Reorder Summary and using the reorder icon to drag an entry to the desired location.
From the Summary tab click View within playbook to open the playbook designer with that step selected.
If you know that you want to add a step at that point, click Add Step.
Displaying Score and Description Results
For a clearer visual display of results, you can set up the source or output step (or both) to display the score and description on the Source and/or Output tab. For the visual display, the source or output results must contain an lhub_score column and a description column.
The following example shows how you can set up the display. This example playbook gets IP addresses from the data source, scores them, and presents the results.
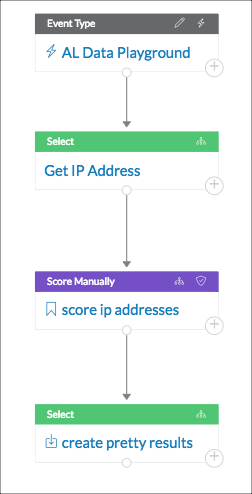
The score step ('score ip addresses' in the playbook) generates the lhub_score using this query:
scoreManually(Get_IP_Address, [])
The output step ('create pretty results') in the playbook reports the lhub_score and also adds a description column by using this query:
`SELECT lhub_score, CONCAT('Unknown IP: ', ip_address) as description FROM score_ip_addresses`
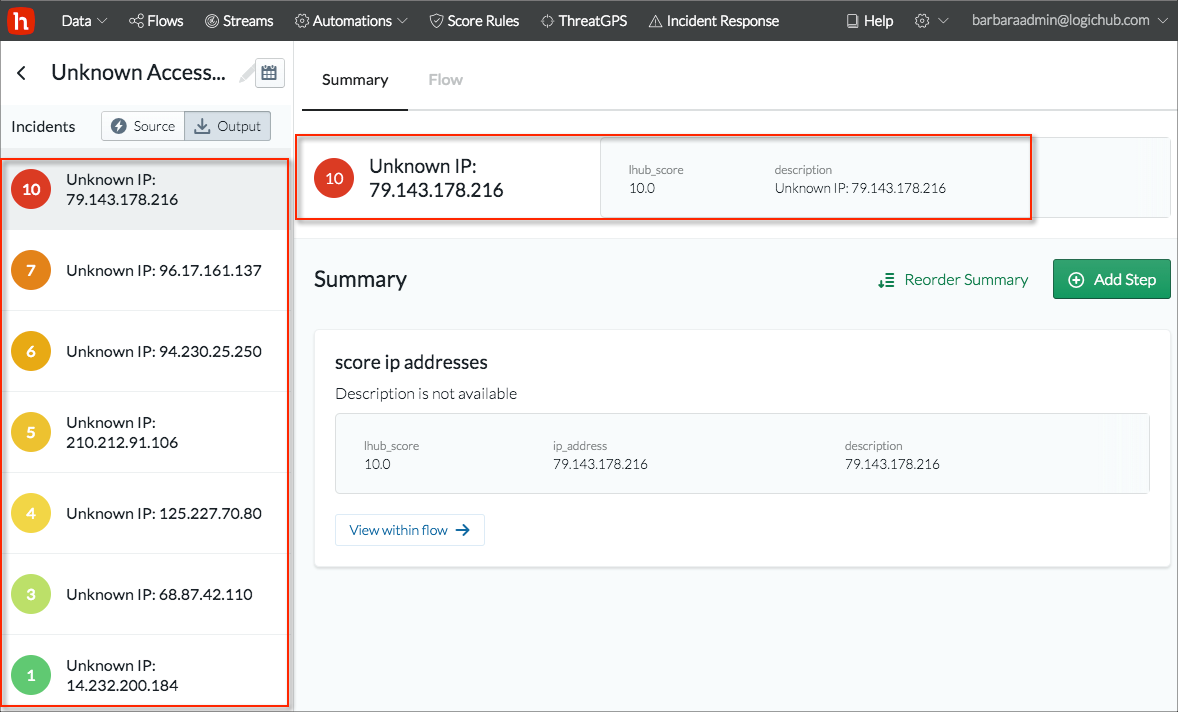
The resulting details page shows the color-coded score results sorted from high to low, plus the description that was generated for the summary or output step.
Custom Incident Response
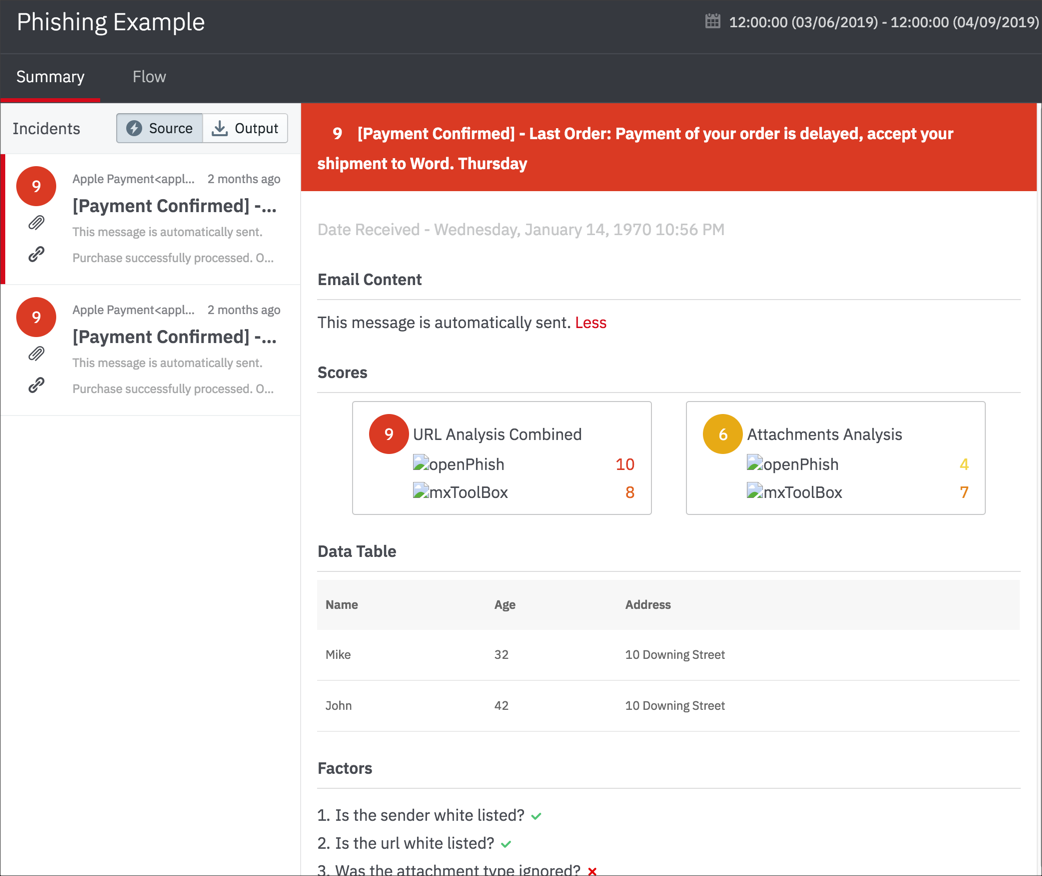
As an alternative to the standard view for incident response, you can set up a custom view that is well-suited to some types of playbooks or streams. For example, for a phishing analysis playbook, you can create a custom incident response view in which the Summary tab displays the incident results as individual email messages on the left and expands the details for a selected message on the right.
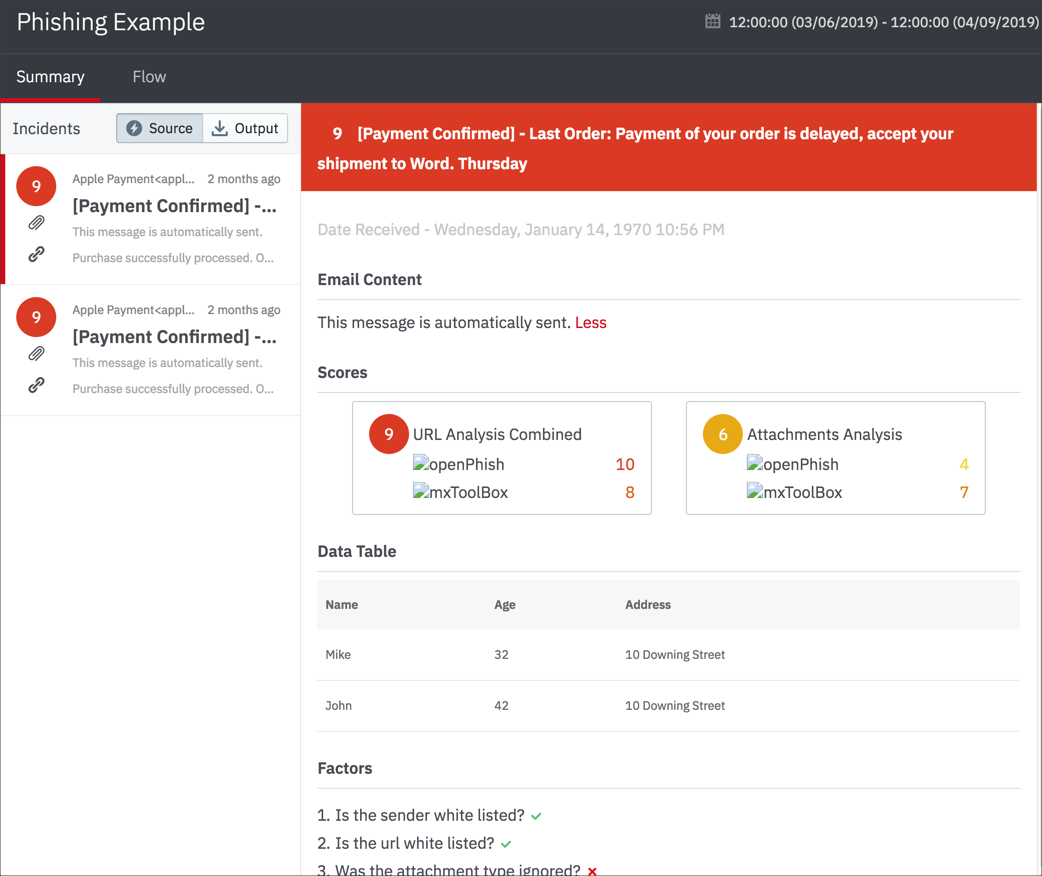
To create a custom incident response view, use the following process:
- Customize a special JSON file that is provided by LogicHub. The file contains the elements required to format the panels in the Summary tab. See the example file below.
- Include the JSON code in the data ingested for the playbook in a column labeled
customView. ThecustomViewcolumn can be from the event type or generated in the playbook itself.
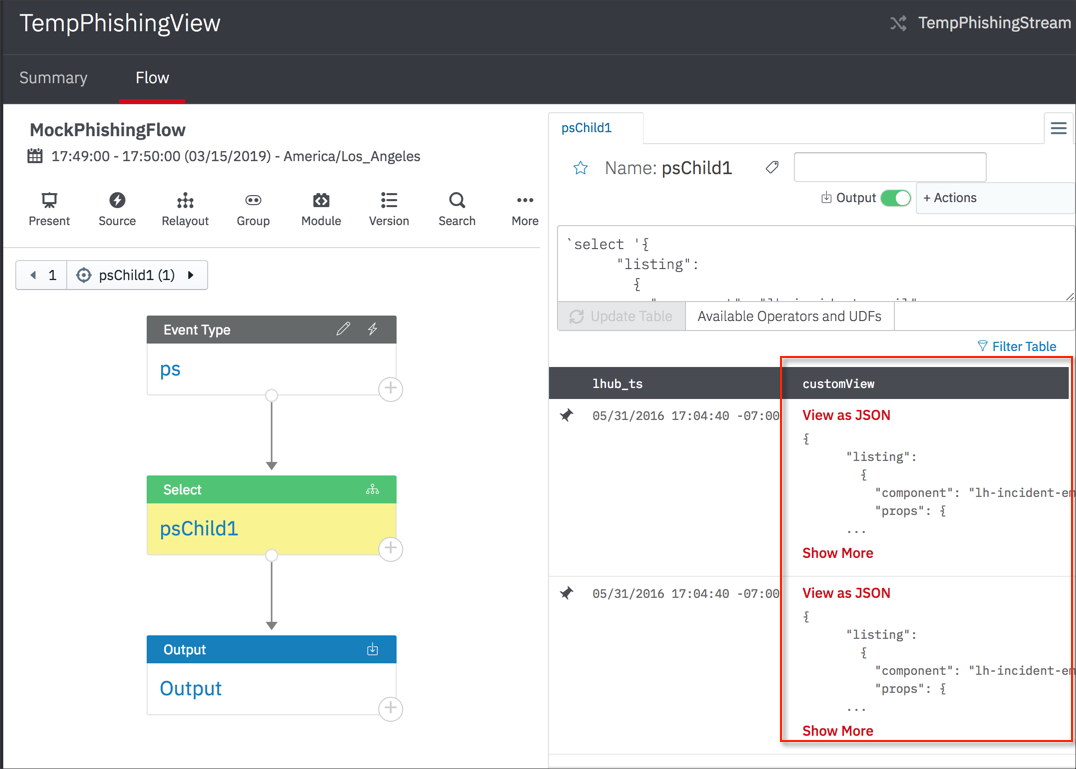
Create an incident response record for the playbook as described earlier in this topic.
Within the incident response playbook, tag any step that includes the customView column as Source or Output.
The Custom view is now presented instead of the standard view.
Example JSON File
You can customize the following JSON file to create the entries for the customView column.
{
	"listing": {
		"component": "lh-incident-email",
		"props": {
			"lhub_score": "9",
			"email_subject": "Apple phish",
			"email_body": "the apple payment",
			"from": "Apple Payment<[email protected]>",
			"timestamp": "1234567890",
			"hasAttachment": "true",
			"hasLink": "true"
		}
	},
	"details": [
		{
			"component": "lh-header",
			"props": {
				"title": "Apple phish",
				"lhub_score": "9"
			}
		},
		{
			"component": "lh-date",
			"props": {
				"lhub_ts": "1234567890"
			}
		},
		{
			"component": "lh-email-body",
			"props": {
				"header": "Email Content",
				"body": "This message is automatically sent."
			}
		},
		{
			"component": "lh-scores",
			"props": {
				"header": "Scores",
				"scores": [
					{
						"title": "URL Analysis Combined",
						"lhub_score": "9",
						"lhub_description": "",
						"individual_scores": {
							"openPhish": "10",
							"mxToolBox": "8"
						},
						"logo": {
							"openPhish": "https://s3-us-west-2.amazonaws.com/lh-public/OpenPhish-Logo.png",
							"mxToolBox": "https://s3-us-west-2.amazonaws.com/lh-public/MxToolBox-Logo.png"
						}
					},
					{
						"title": "Attachments Analysis",
						"lhub_score": "6",
						"lhub_description": "",
						"individual_scores": {
							"openPhish": "4",
							"mxToolBox": "7"
						},
						"logo": {
							"openPhish": "https://s3-us-west-2.amazonaws.com/lh-public/OpenPhish-Logo.png",
							"mxToolBox": "https://s3-us-west-2.amazonaws.com/lh-public/MxToolBox-Logo.png"
						}
					}
				]
			}
		},
		{
			"component": "lh-table",
			"props": {
				"header": "Data Table",
				"columns": [
					{
						"title": "Name",
						"dataIndex": "name",
						"key": "name"
					},
					{
						"title": "Age",
						"dataIndex": "age",
						"key": "age"
					},
					{
						"title": "Address",
						"dataIndex": "address",
						"key": "address"
					}
				],
				"data": [
					{
						"key": "1",
						"name": "Mike",
						"age": "32",
						"address": "10 Downing Street"
					},
					{
						"key": "2",
						"name": "John",
						"age": "42",
						"address": "10 Downing Street"
					}
				]
			}
		},
		{
			"component": "lh-factor",
			"props": {
				"header": "Factors",
				"factors": {
					"Is the sender white listed?": "true",
					"Is the url white listed?": "true",
					"Was the attachment type ignored?": "false"
				}
			}
		},
		{
			"component": "lh-actions-taken",
			"props": {
				"header": "Actions taken",
				"actions": [
					"Email sent",
					"Ticket created"
				]
			}
		}
	]
}
Example Playbook
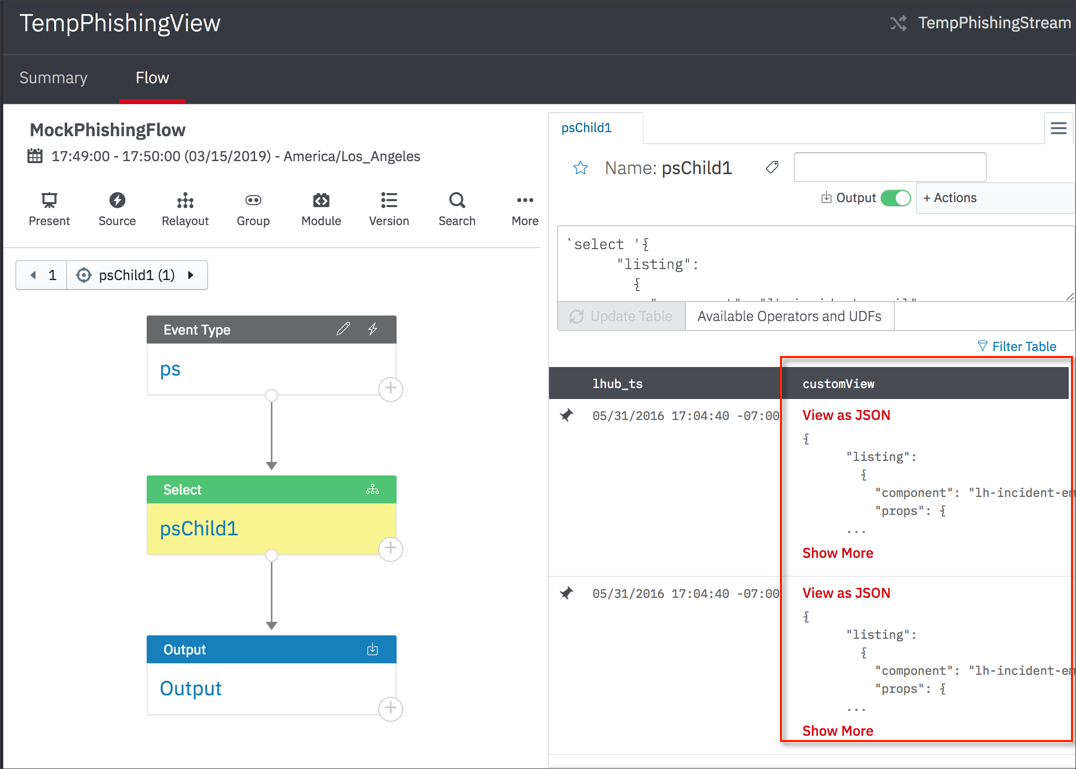
In this playbook, the psChild1 and Output steps both have a customView column that contains the JSON for a custom view. Each row has a JSON object that corresponds to a row in the incident summary list for the incident response.
Updated over 2 years ago