System Dashboards
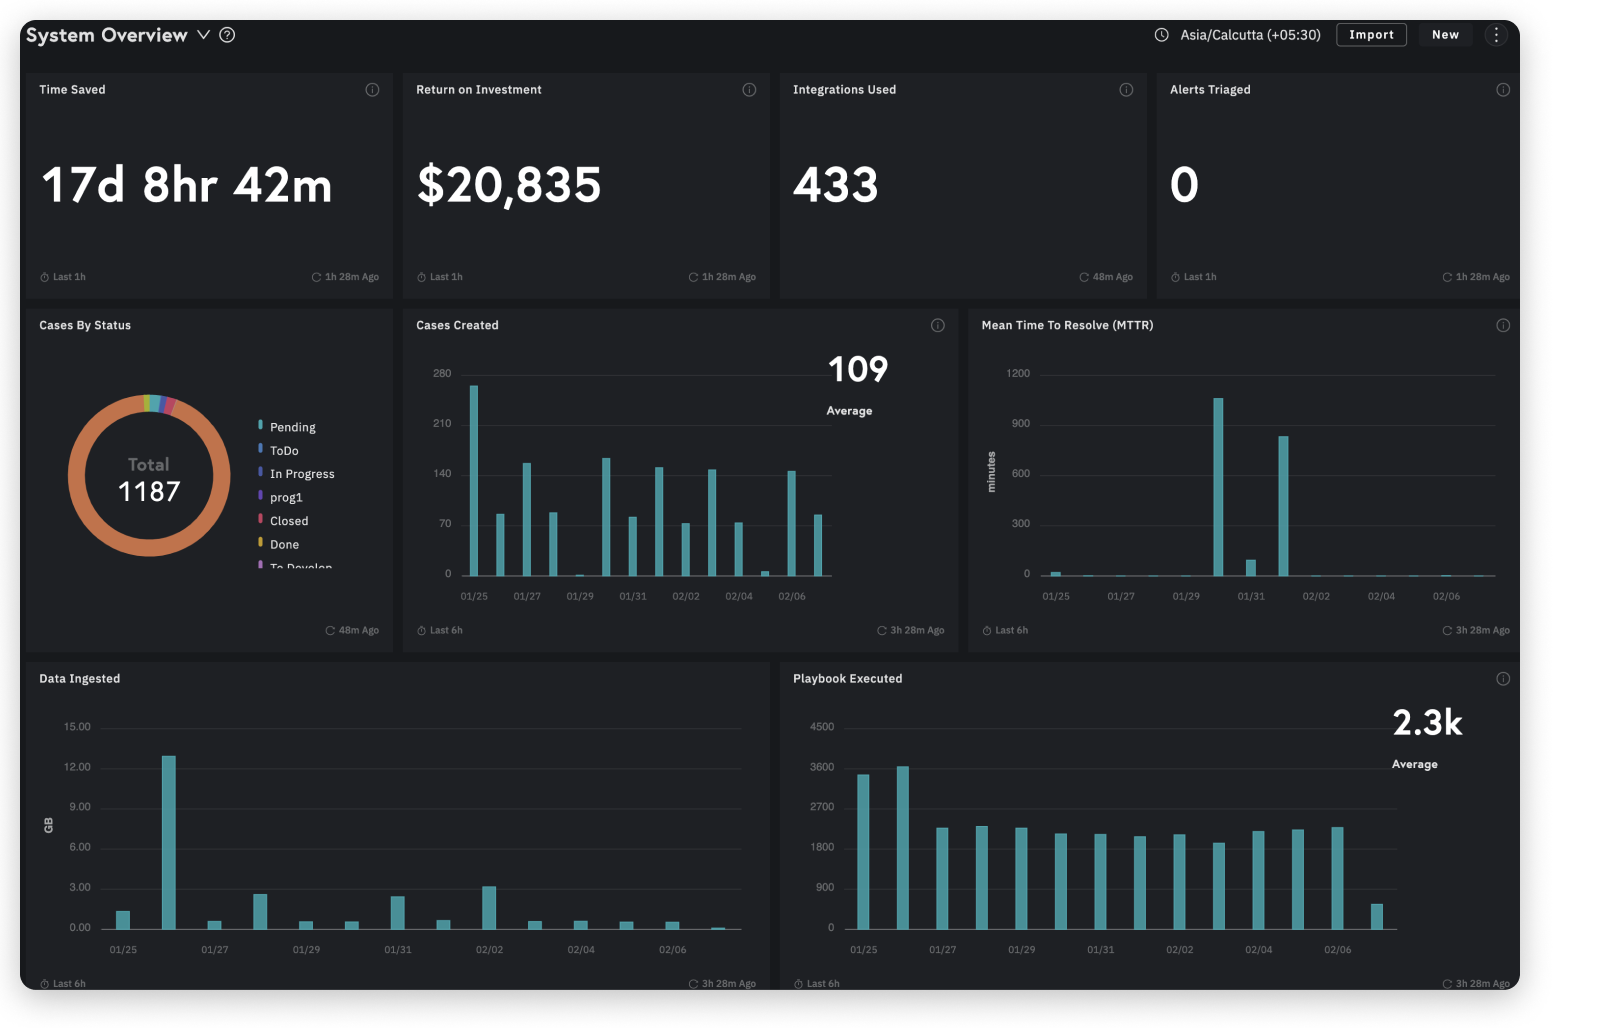
LogicHub provides multiple system dashboards that includes System Overview and an MITRE Dashboard, which are based on MITRE data. Let's look at each of the dashboards in detail.
System Overview Dashboard
The system overview dashboard components depict the current system metrics by way of charts and numeric values. Each component display includes the type of metric, the data presentation, and the calculation period. When you log into the LogicHub User Interface, the System Overview dashboard is presented as the default landing page.

Timezone
The dashboard allows you to view and modify timezone for System Overview, Use Case, and MITRE Dashboards. The timezone will not be visible for custom dashboards.
To change the timezone settings on the dashboard:
- Go to Settings > Account on the left navigation.
- Click on the Timezone tab and select the timezone from the Default Timezone for System Dashboards drop-down based on your preference.
- Only administrators can change the dashboard timezone. If you're a non-administrator contact your administrator to change the timezone.
To switch to a different dashboard:
- Click the arrow to the right of the System Overview header and then select the desired dashboard from the drop-down list that appears.
- Hover on the information symbol or the chart elements in the dashboard charts to view more information about the data that is being displayed.
What's Next
🔗 Dashboard
🔗 Manage Dashboard
🔗 Create Custom Dashboard
📍 System Dashboards
Updated almost 2 years ago