Getting Started
The Getting Started guide walks you through the building blocks of DevoSOAR and how to build your own playbook.
By the end of this, you will be able to build your own playbook using connections and event types, streams and case management to schedule and track the cases respectively.
Requirements
Supported Browsers
All you need is the latest version of the Google Chrome browser to explore the DevoSOAR application.
Explore DevoSOAR
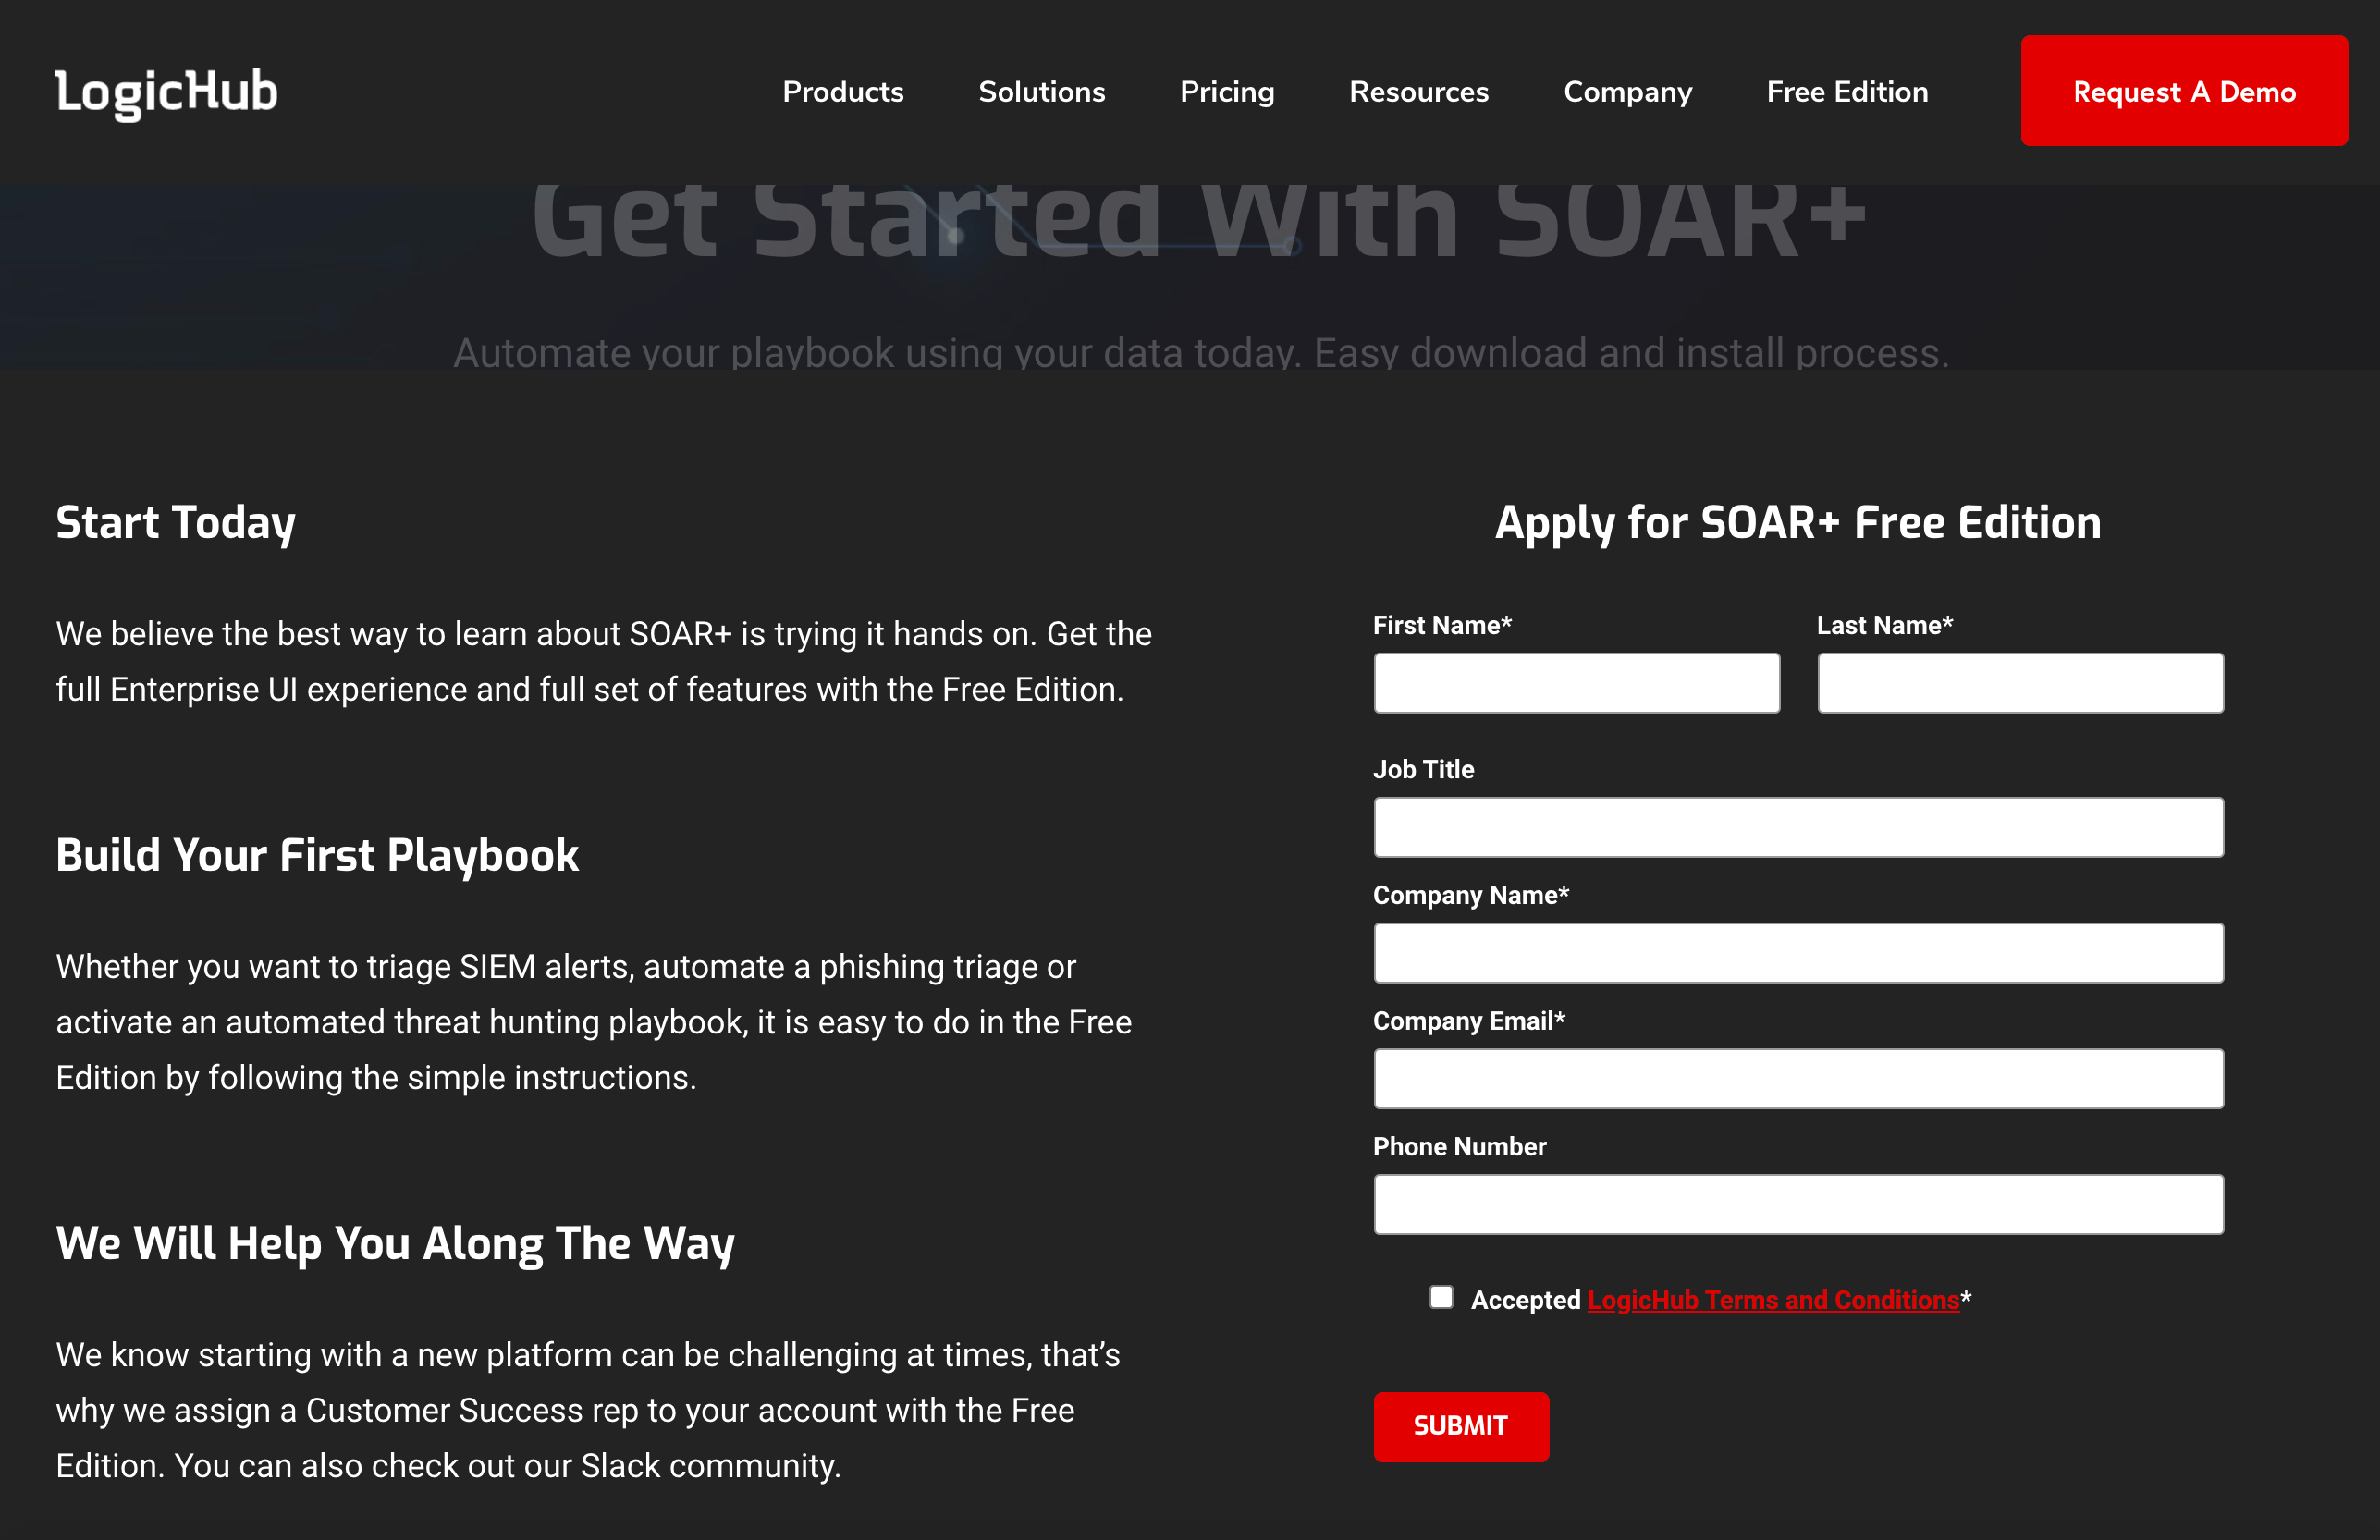
Check out our Free Edition to explore the application. Enter your details and click Submit. A message will be displayed that download instructions will be sent to your email address. Once you receive the download instructions, go to the URL and sign in.
For Enterprise Edition set up, see Enterprise OVA Set Up.
Building Blocks of DevoSOAR
Let’s look at the building blocks of the DevoSOAR product. To automate your data, you need to understand some of the basic terms used in DevoSOAR.
Playbooks
Playbooks are the graphical representations of the logic that the security analyst goes through to make decisions about events. Playbook execution ranks security events such that the critical events at the top.
Playbooks allow you to automate the process of identifying undesirable events and responding to them. For more information, refer to Playbooks.
To build a playbook, you need:
- Connection
- Event Types
Connection
Connections allow you to ingest data into DevoSOAR from your security information and event management (SIEM) environment. A connection creates a link between DevoSOAR and an external system such as a SIEM environment. Connections are how you connect to a SIEM such as Devo, Elasticsearch, Splunk, SumoLogic. For more information on connections, refer to Create Connections.
Event Types
Event types are the queries that get specific events from your connections and yield the results for analysis and scoring. The queries are the same native queries that you would run on your SIEM.
Event types can draw from any of the following source types: results of a query on an external source, such as Splunk, SumoLogic, or Elasticsearch. For more information on event types, refer to Create Event Types.
Stream
Streams allow you to automate the analysis logic codified in the playbooks and apply it to upcoming events on a fixed interval, creating batches of results. You can set up streams to run at a set interval (such as every 30 minutes), and apply a playbook to each. Within each stream, you can drill down to see why alerts were scored in a particular way, and what portions of the playbook contributed to the scoring. For more information on streams, refer to Create a Stream.
Case Management
DevoSOAR provides an integrated case management capability for you to track activity related to investigations of threats and other security issues. For more information on how to create cases, refer to Create Cases to Track Work in DevoSOAR.
Dashboard
DevoSOAR allows you to create your own custom dashboard to monitor any metric. When you log in to the DevoSOAR application, a System Overview page opens up as the landing page that provides detailed information on the data ingested, time saved, return on investment, integrations used, alerts triaged, cases by status, cases created, mean time to resolve, and playbook executed. For more information on dashboards, refer to Dashboards.
How to Build a Sample Playbook
Let’s look at an example of how to build your own playbook.
As we already know that Playbooks is one of the key features of DevoSOAR that allows you to automate the process of identifying undesirable events and responding to them. In this demo, we'll identify non-users who tried to change passwords and create a case for each such event.
First, let’s begin with creating a connection to SIEM. Why do you need a connection, see Connections under Building Blocks of DevoSOAR.
Create a Connection
To create a connection:
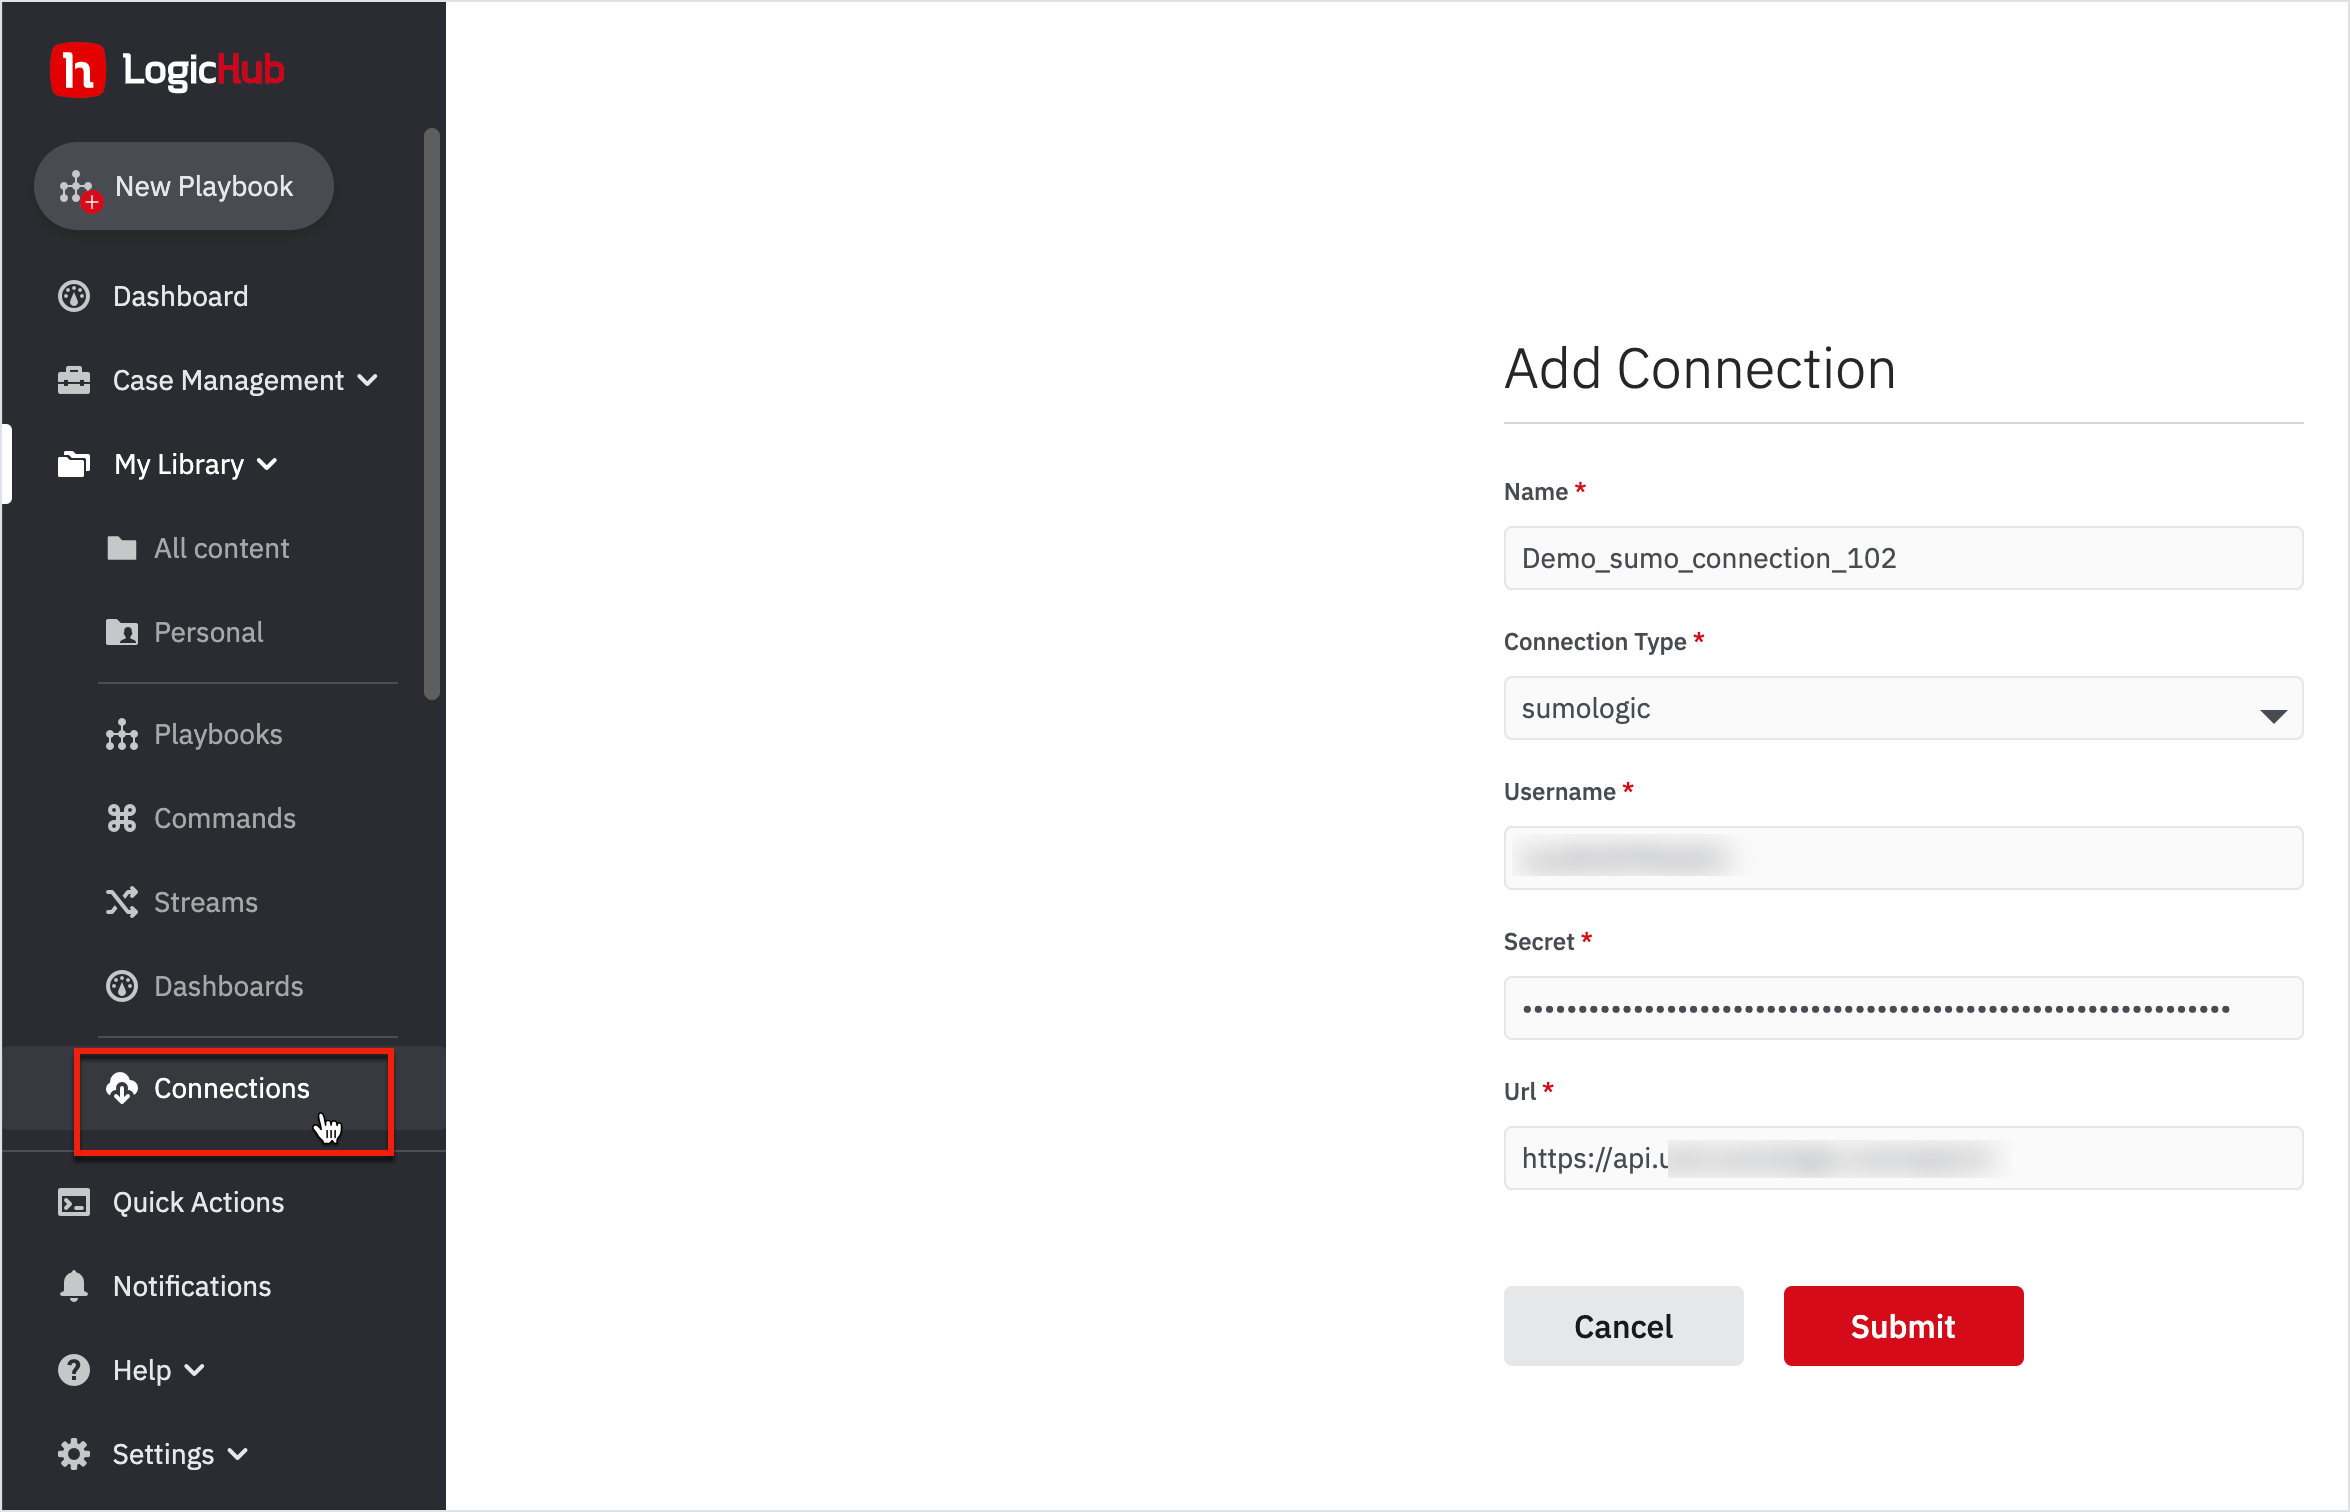
- Go to My Library > Connections on the left navigation.
- Click New on the top-right corner. The Add Connection form opens up.
- Enter a connection name as 'Demo_sumo_connection_102'.
- Choose the Connection Type to be 'Sumologic'.
- Enter the Username, Secret, and the URL as provided by the administrator.
- Click Submit.
You’ve successfully created a connection now.
The next step is to create an event type.
Create an Event Type
To create an event type:
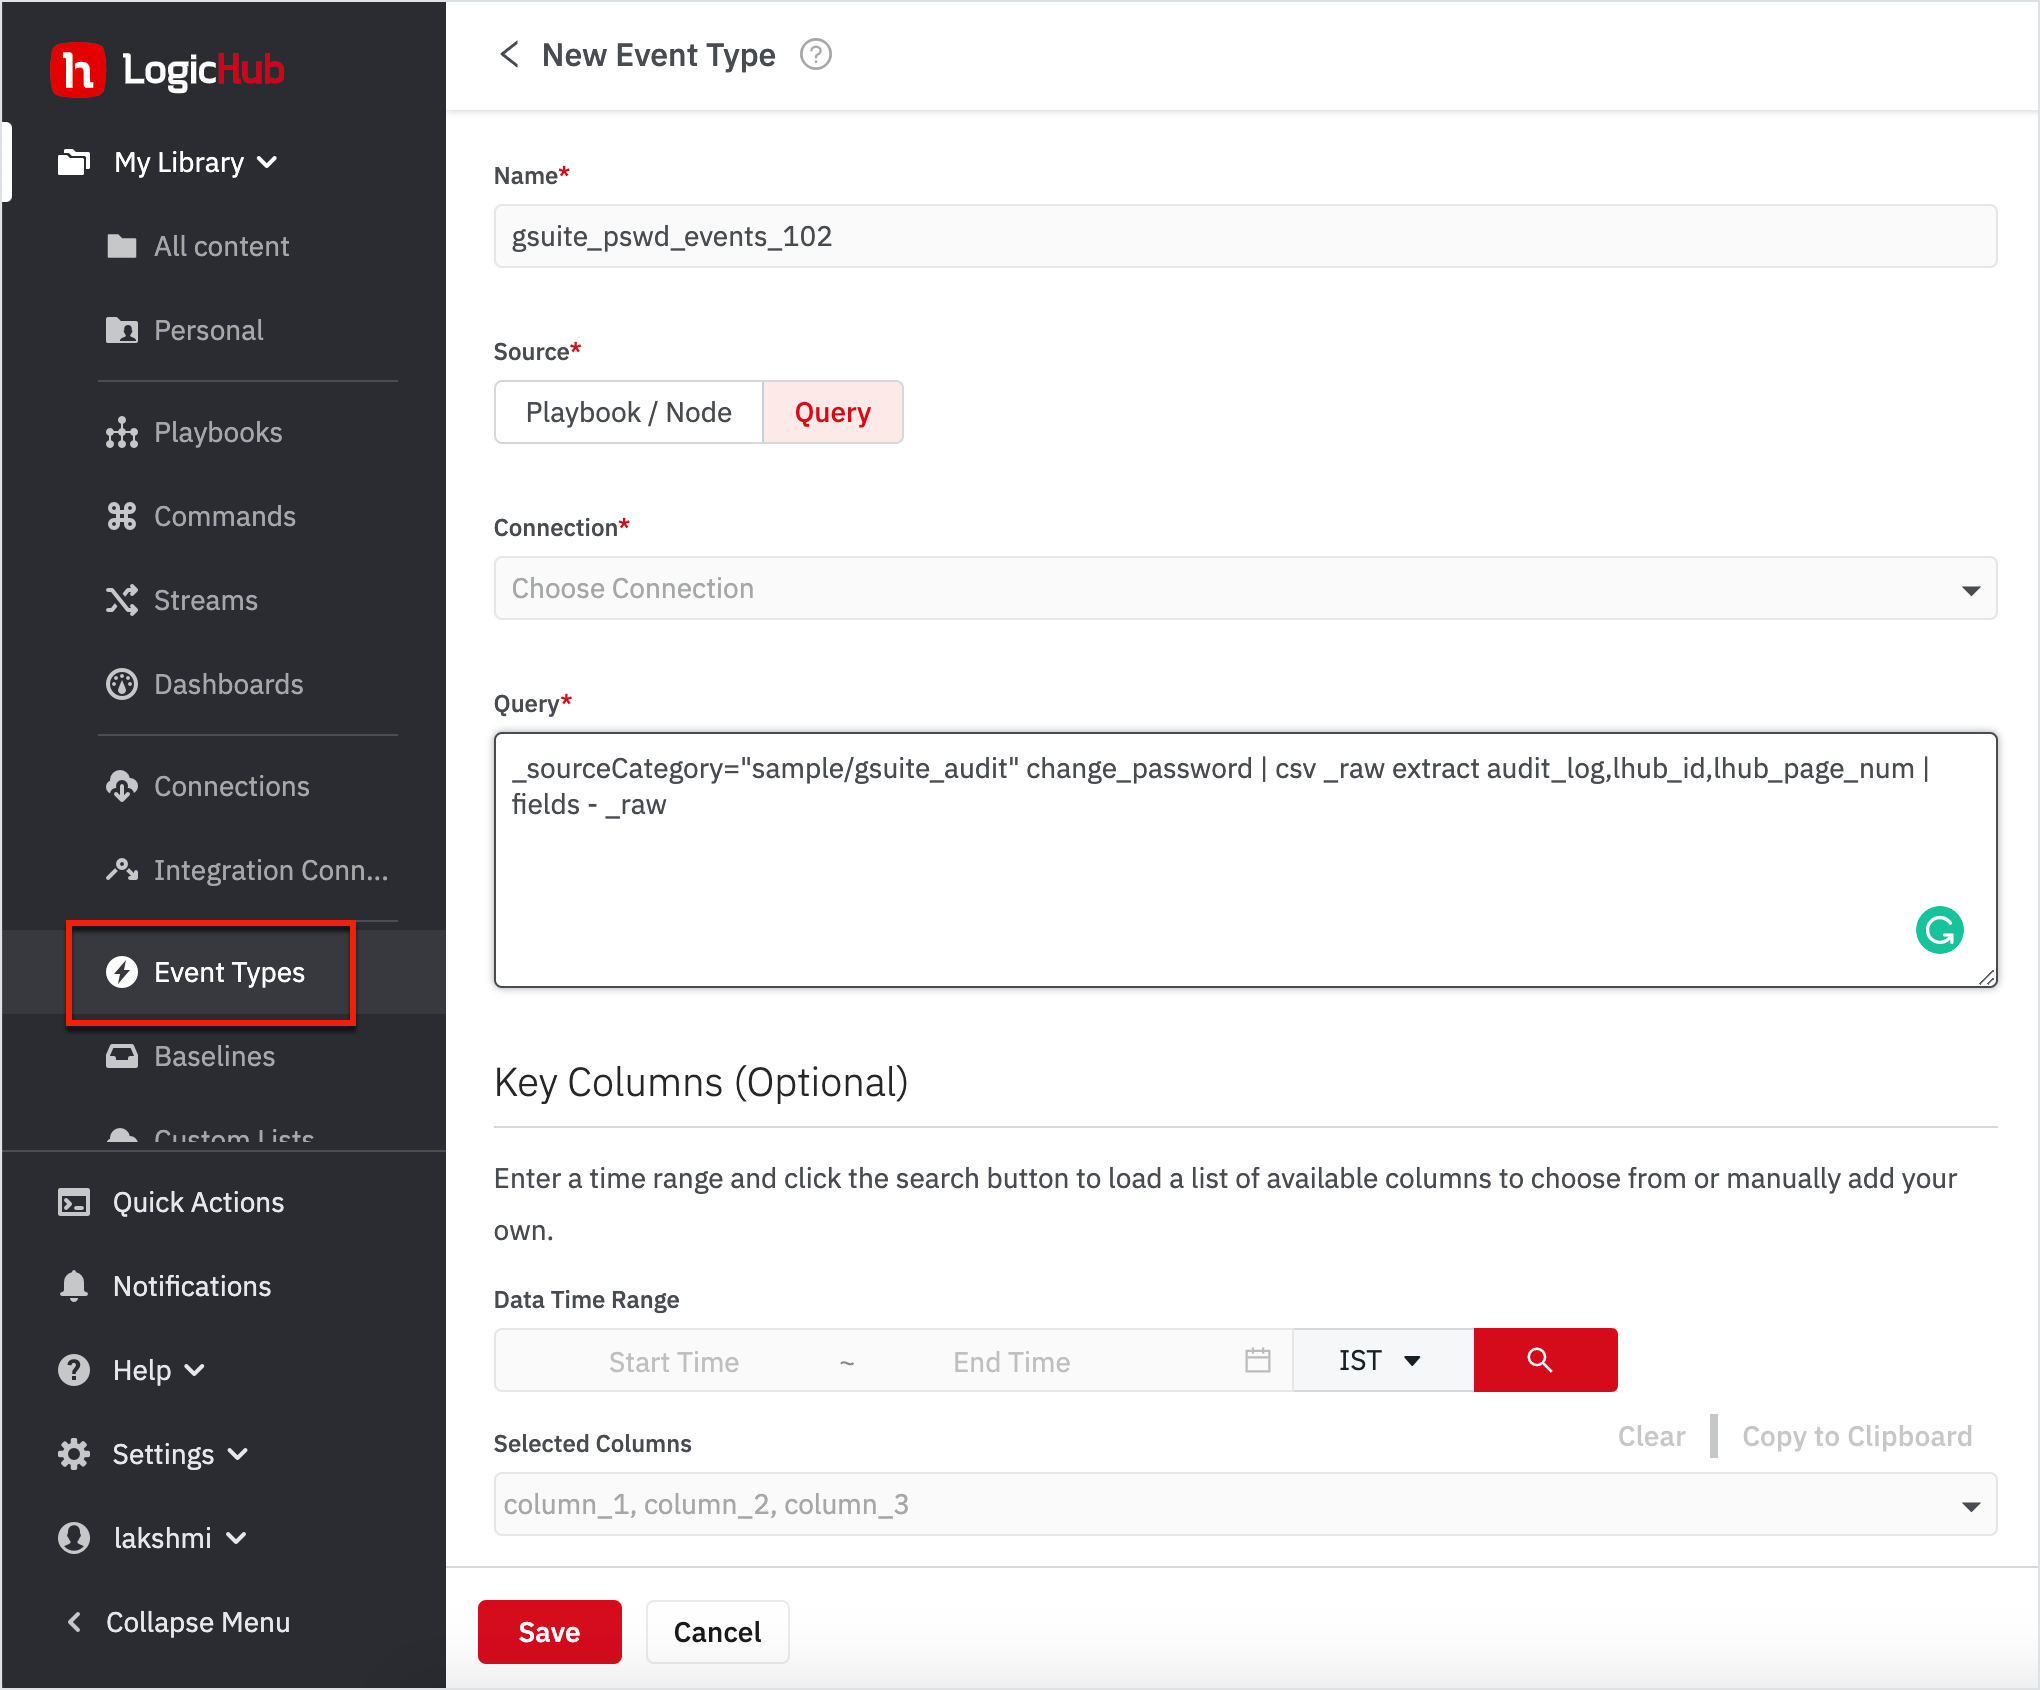
- Go to My Library > Event Types on the left navigation.
- Click New on the top-right corner. A New Event Type form opens up.
- Enter the event name as 'gsuite_pswd_events_102'.
- Select the source to be Query.
- Choose the Connection from the drop-down.
- Enter the Query.
_sourceCategory="sample/gsuite_audit" change_password | csv _raw extract audit_log,lhub_id,lhub_page_num | fields - _raw
- Click Save.
You’ve successfully created an event type.
At any point in time, if you want to view the event type that you created, navigate to the Event Types page from My Library to view the list of event types; search for the one that you created.
Once you've created a Connection and an event type, let’s now get into the real intent to achieve the goal - and the goal is to find the bad logins through the Playbook.
Create a Playbook
To create a new playbook, go to My Library > Playbooks on the left navigation.
- Click on the New Playbook on the left navigation or click New on the top-right corner.
- Click on New Blank Playbook.
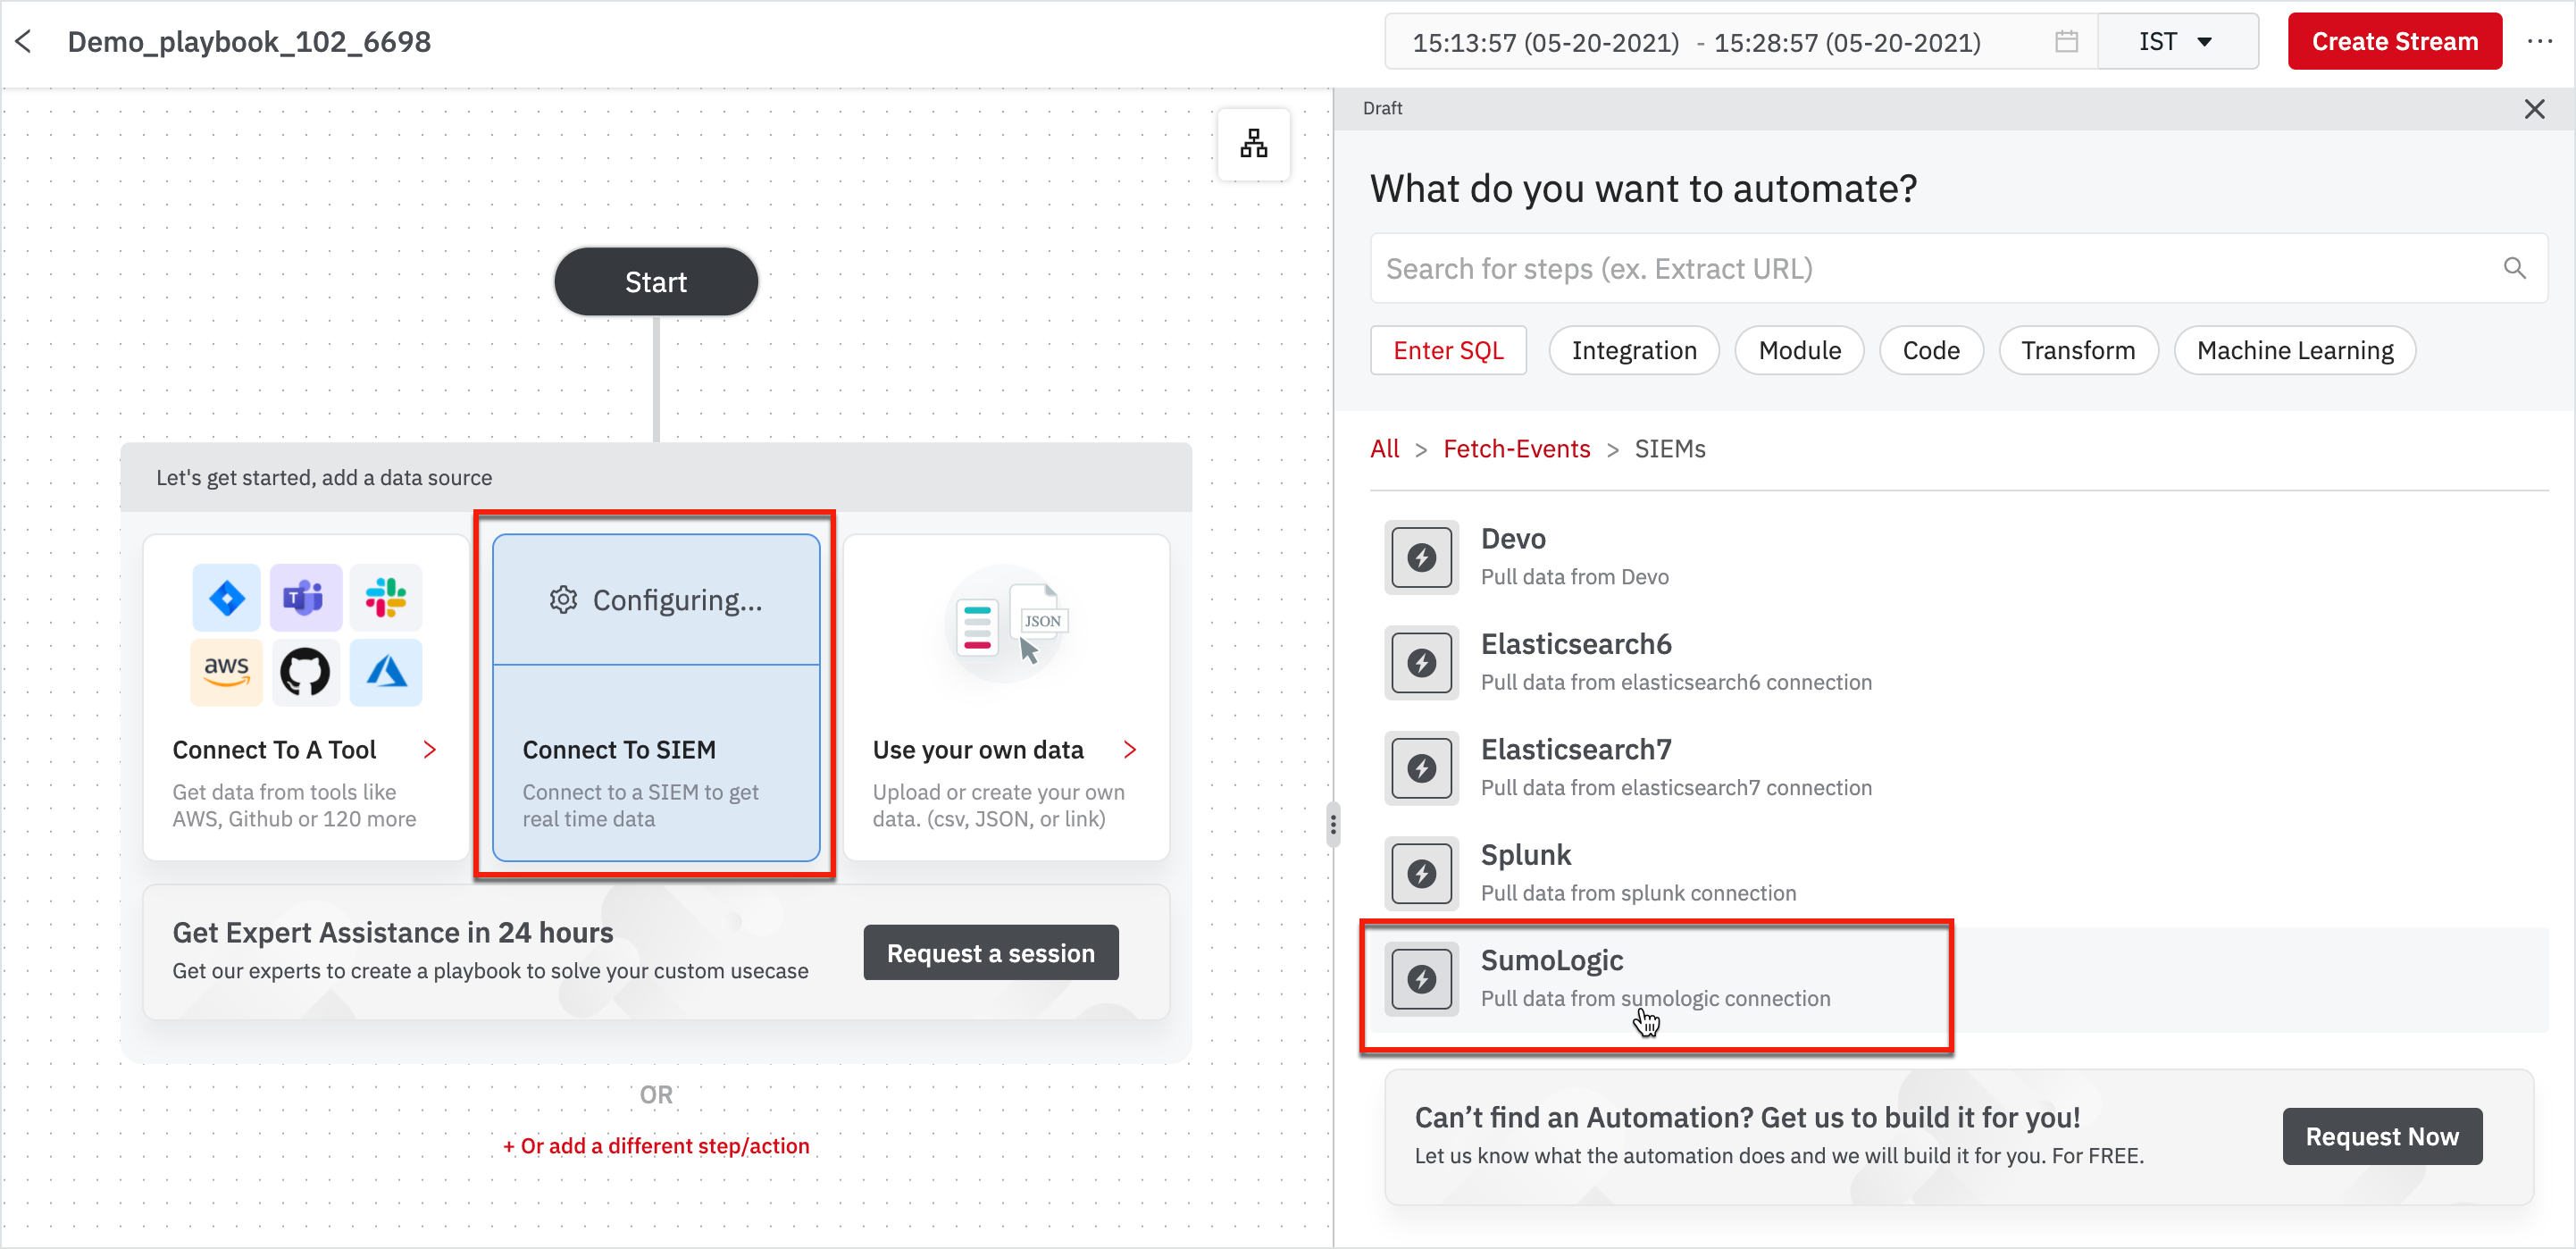
The first step in creating a Playbook is to ingest sample events to build your logic on and test. We've already created an event type that connects to Sumologic to bring in 'change password' events from Gsuite.
- Click Connect To SIEM under the Start node.
- Click Sumologic from the right pane that appeared.
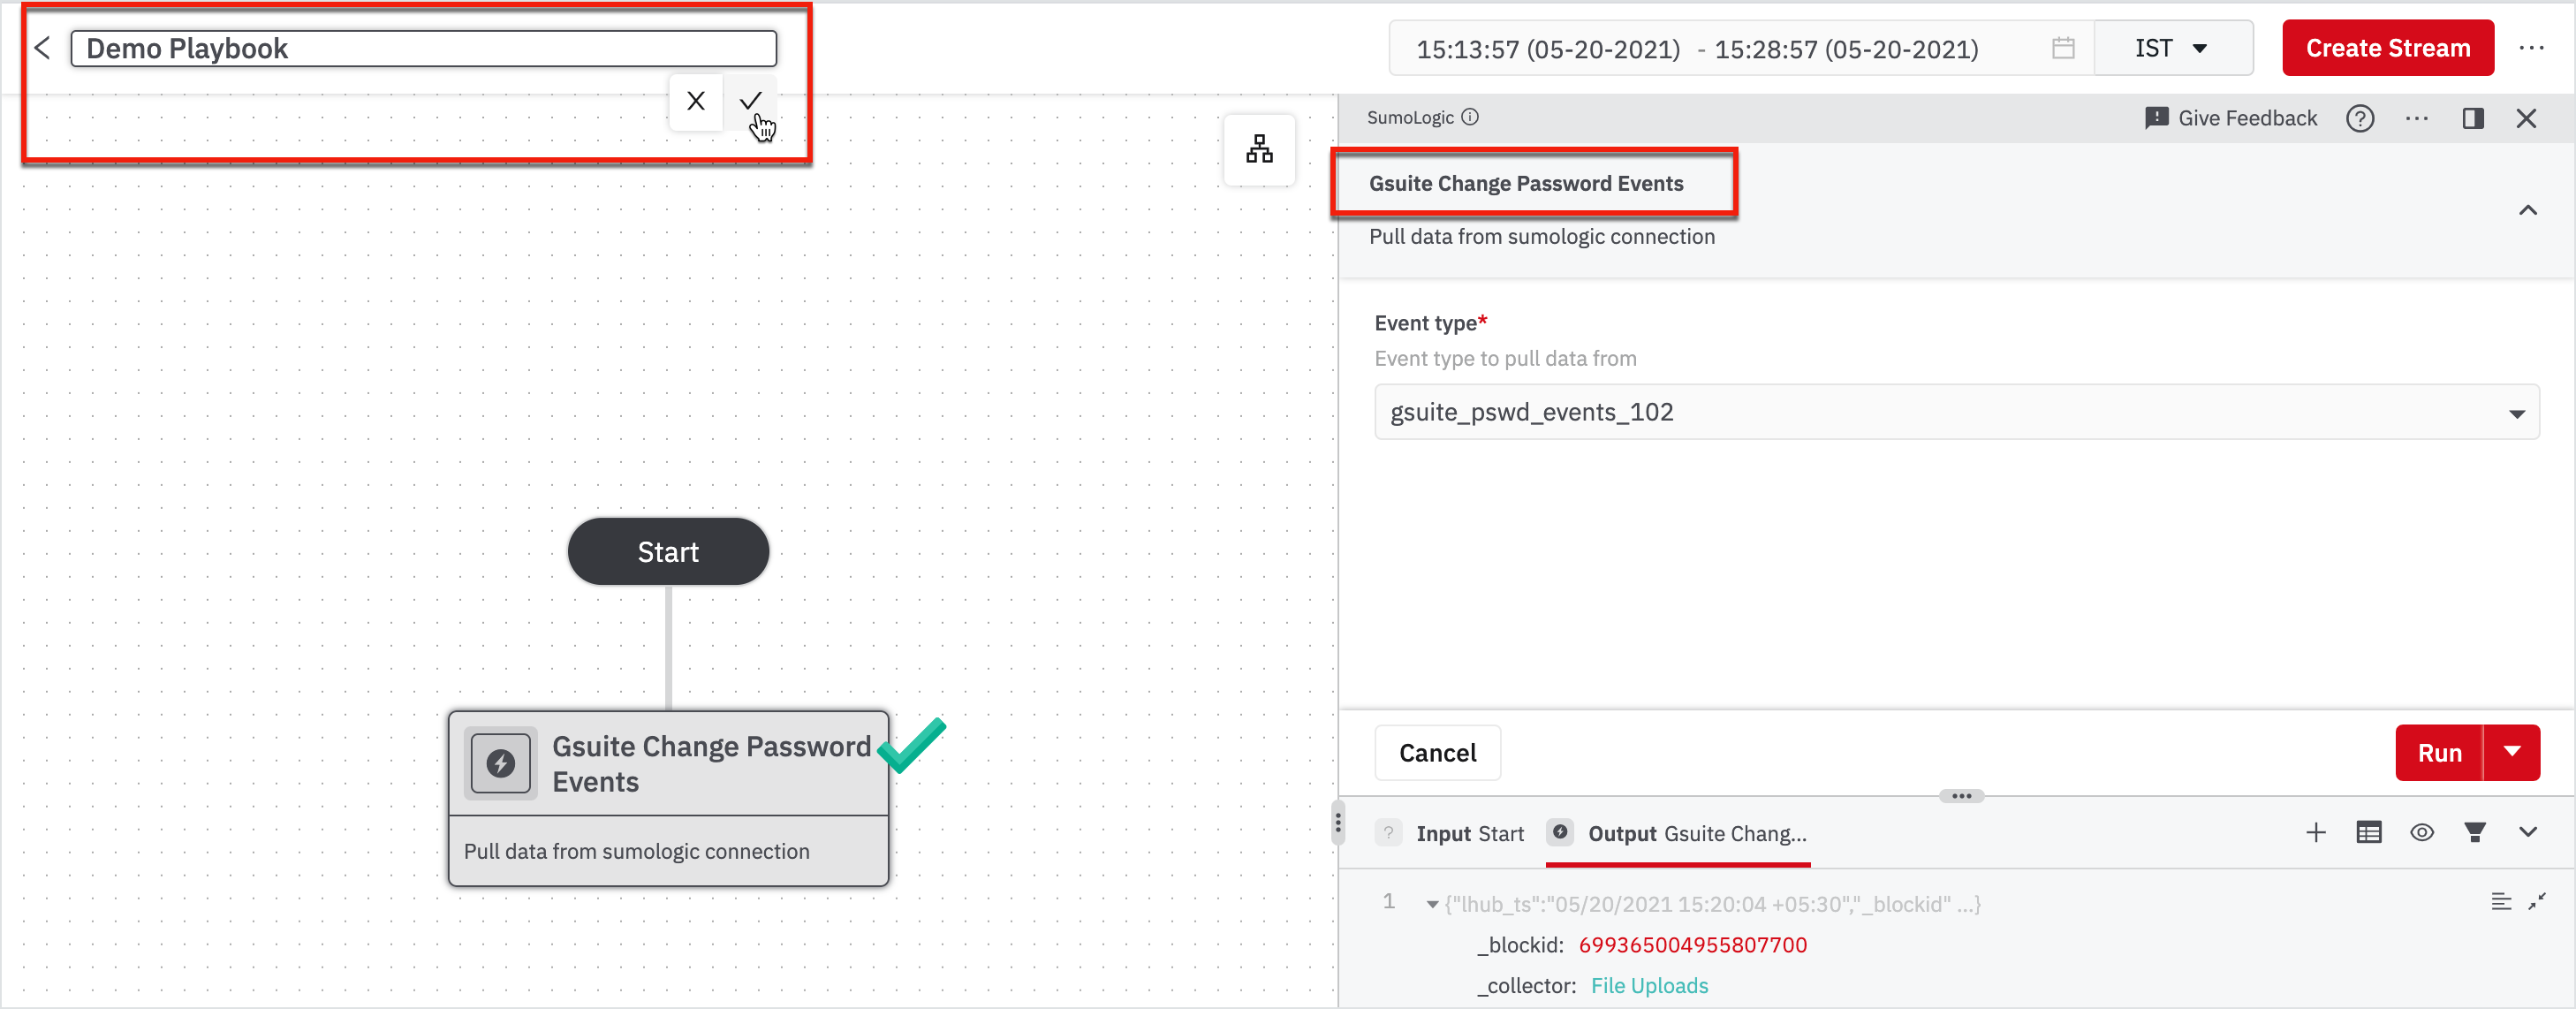
- Choose the event type as gsuite_pswd_events_102.
- Click Run.
After you choose the event type, rename the node to ‘Gsuite Change Password Events’ and rename the playbook as you wish.
Renaming the nodes helps you and other team members to identify and understand what a particular node does. You can also choose to describe the node. For more information about Playbook editing, see Edit a Playbook.
Note
After you run the node, if there is no data, this is because the Sumologic instance has no record of events that occurred during the time you selected for the sample data. We recommend changing the time period in the title bar, on the top-right corner of the page.
Create a Playbook to Find Bad Events
To identify bad password change events, we have to know more about the actor's IP address. We need to identify where the information about the IP address is. You can analyze the data in various ways. To know more about data in Playbooks, see Work with Steps and Results Panel.
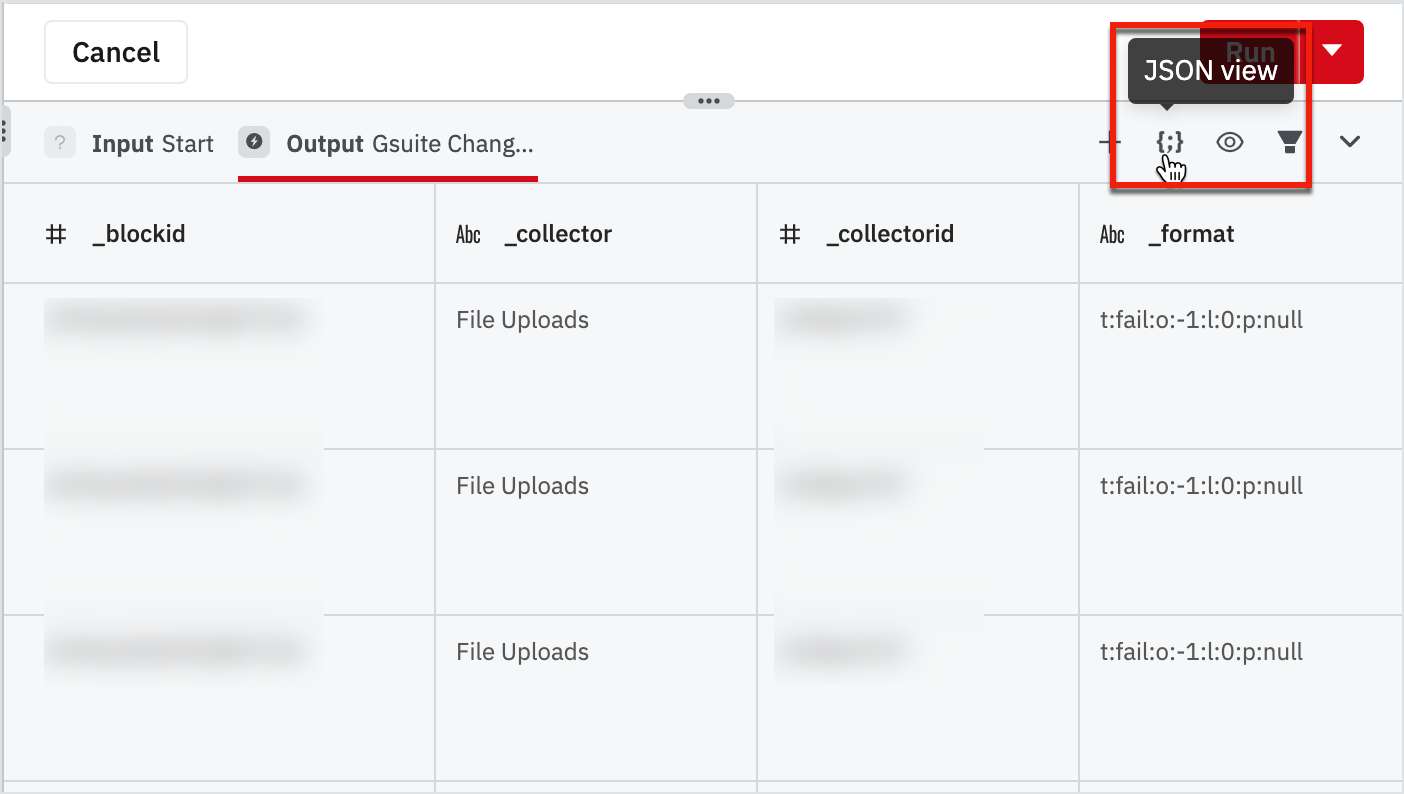
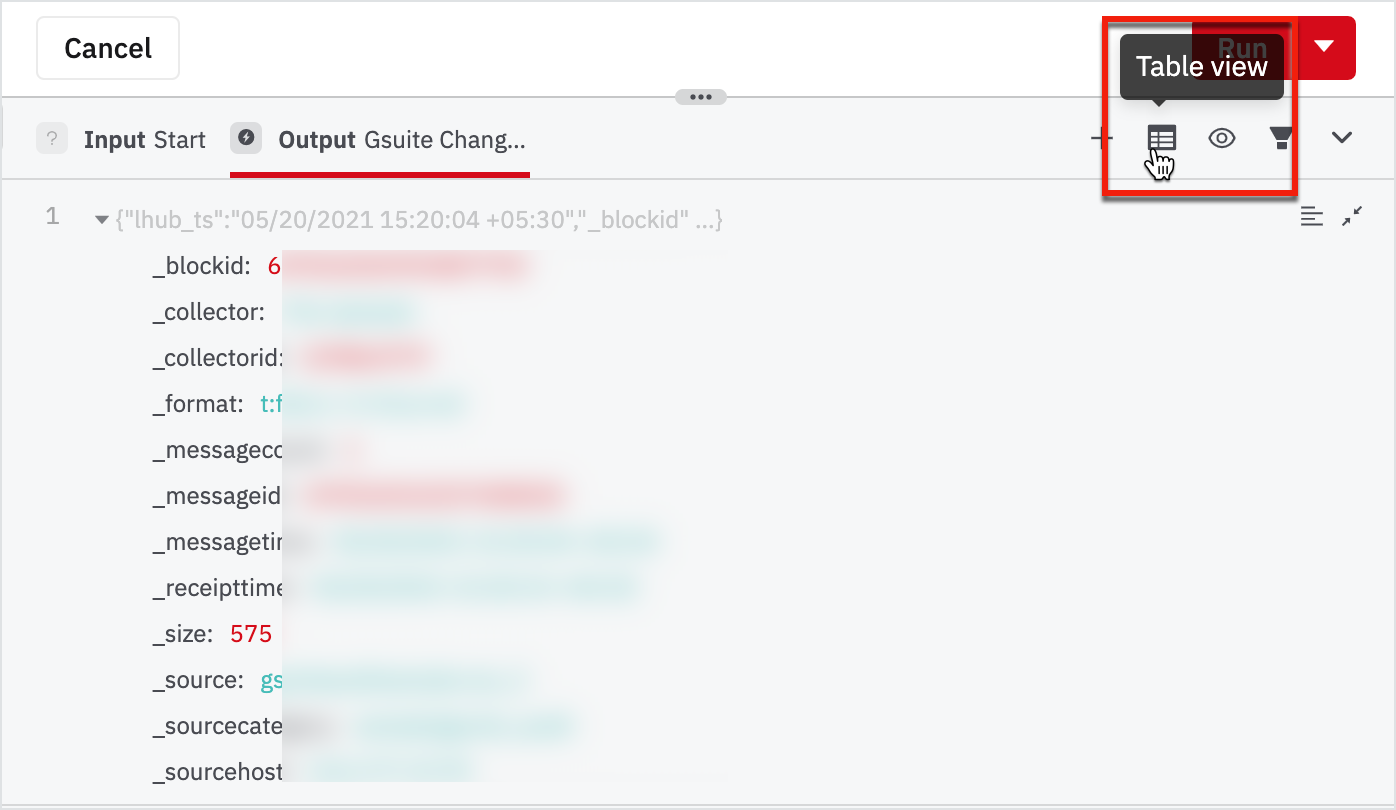
- Explore table view and JSON view by clicking on the view switcher on the top-right corner of the data pane.
- Find and take a note of the field called "ipAddress" inside "audit_log".
Table View
JSON View
Our goal was to identify non-users who are trying to change passwords. One way to do that is to check if their IP addresses are blacklisted by a threat intelligence organization. Here, we'll use a service called SANS BlackList Integration.
- Hover on the node: Gsuite Change Password Events and click on + on the node.
- On the right pane, search for sans and click on SANS Blacklist - IP Lookup from the list.
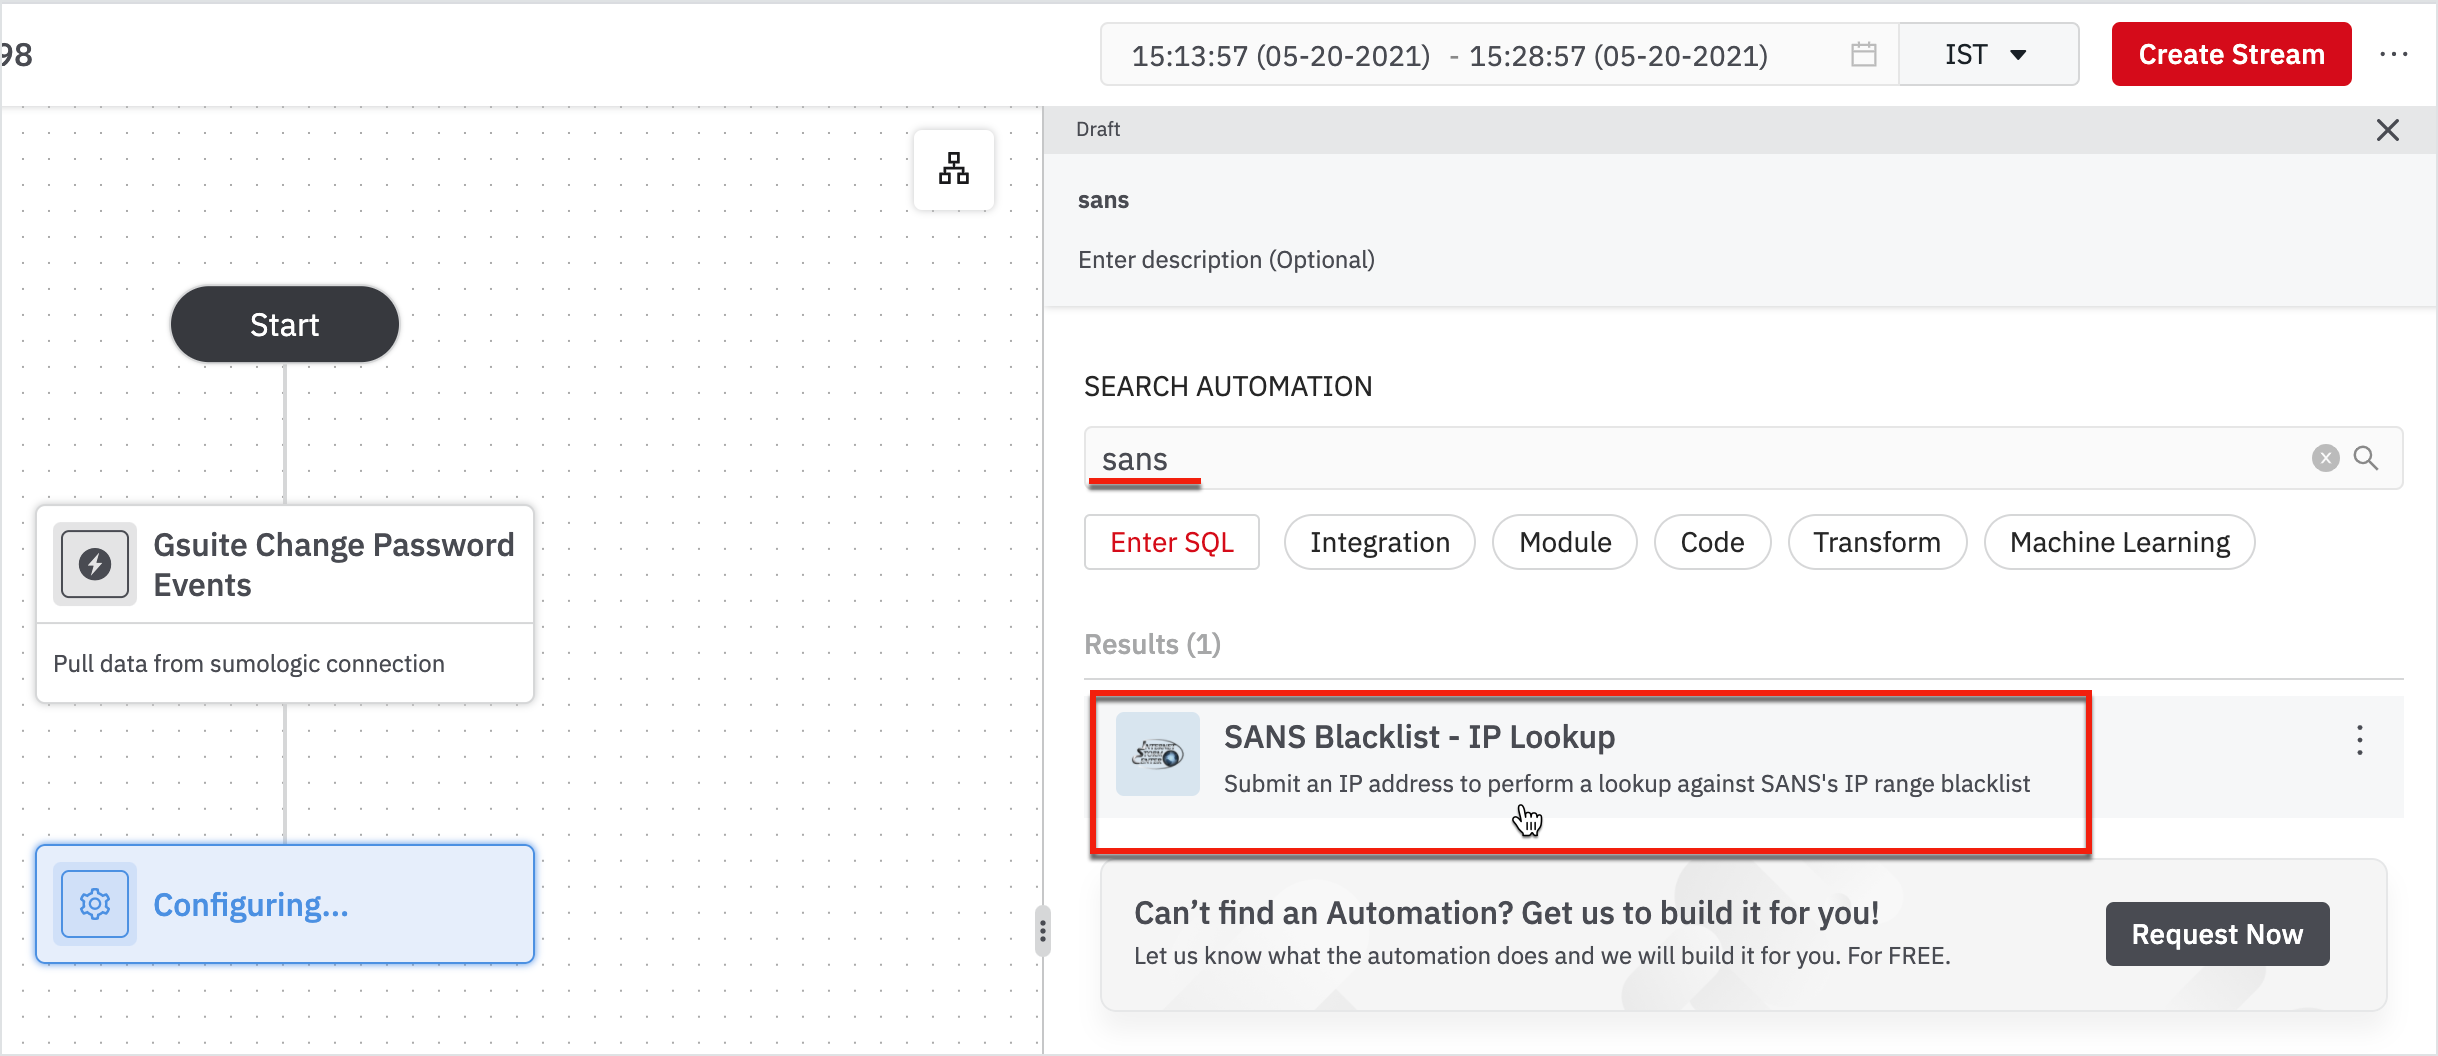
To connect to some Integrations in DevoSOAR, you need to authenticate. In this case, we have already made a connection for you. Then you have to send IP to sans blacklist integration and get back blacklist information.
- Enter the Connection name for SANS Blacklist integration in the right pane and click Next.
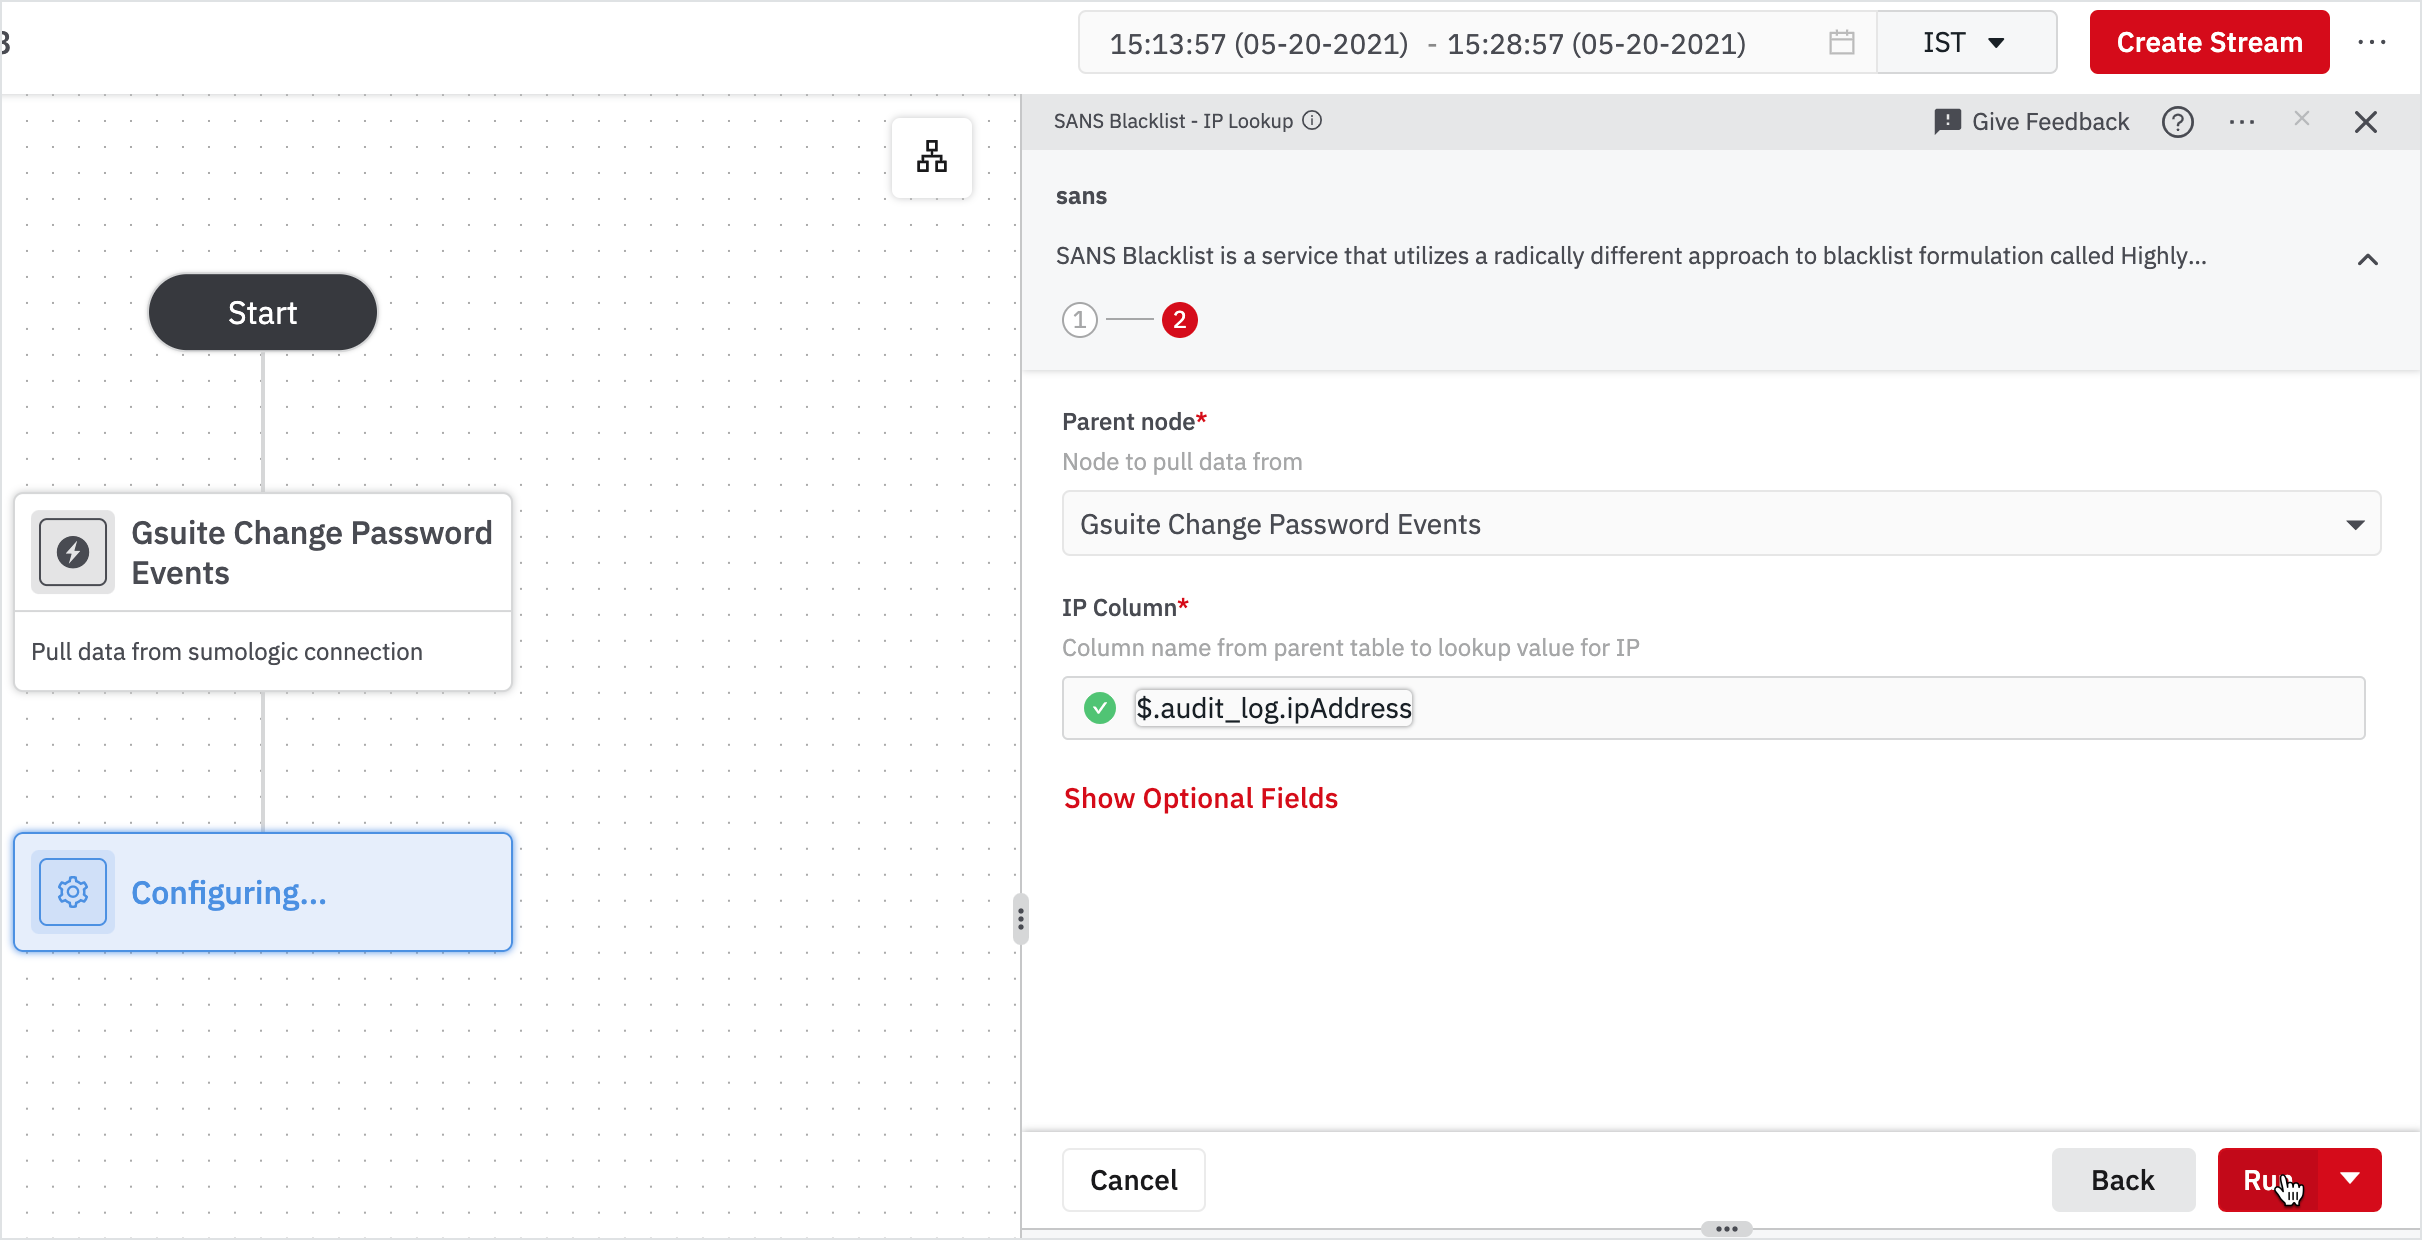
Note: The parent node will be 'Gsuite Change Password Events' by default. - Enter the IP column name as '$.audit_log.ipAddress'.
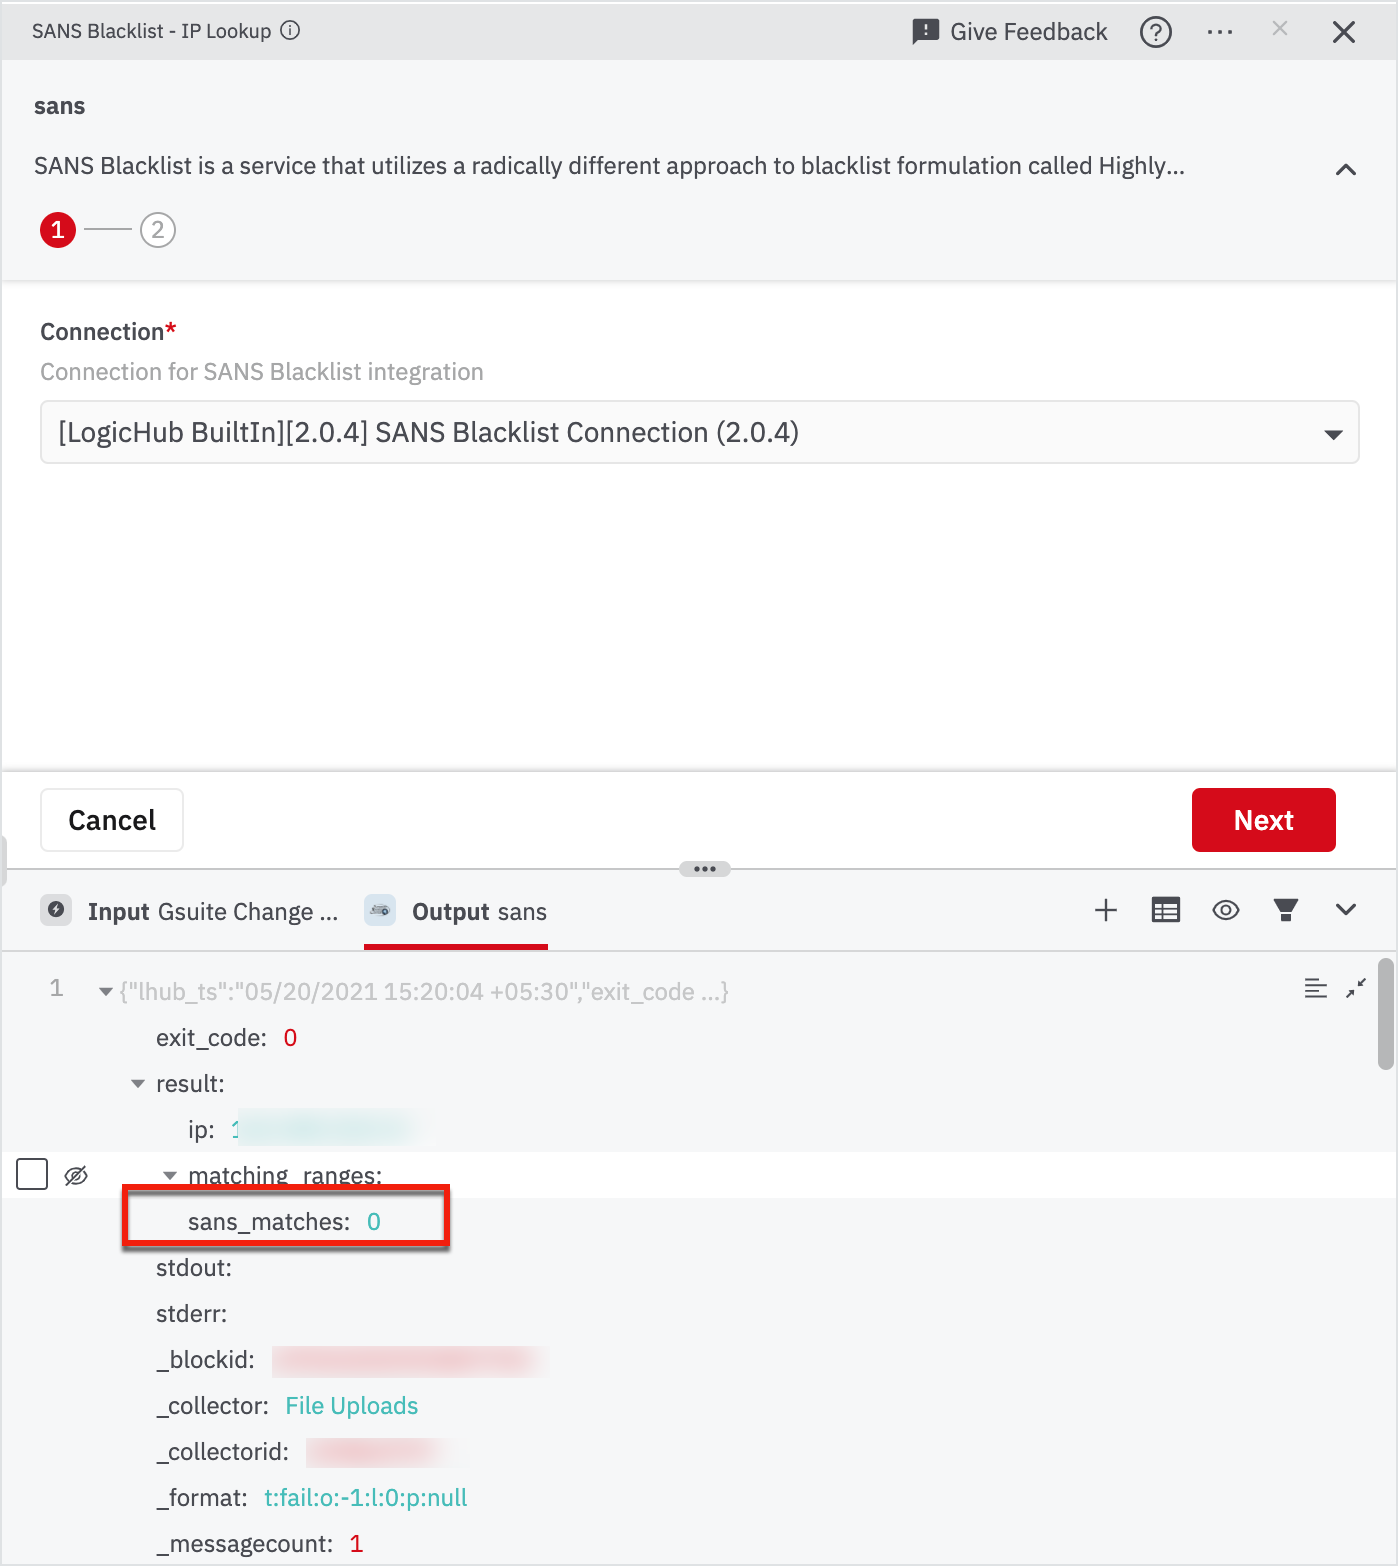
Expand the Output section on the right pane and Find "sans_matches". If sans_matches > 0, means the corresponding IP is blacklisted, so we need to filter only those out.
- Hover on the node: sans and click on the + button.
- Search for "filter" and click on "Filter" in the results.
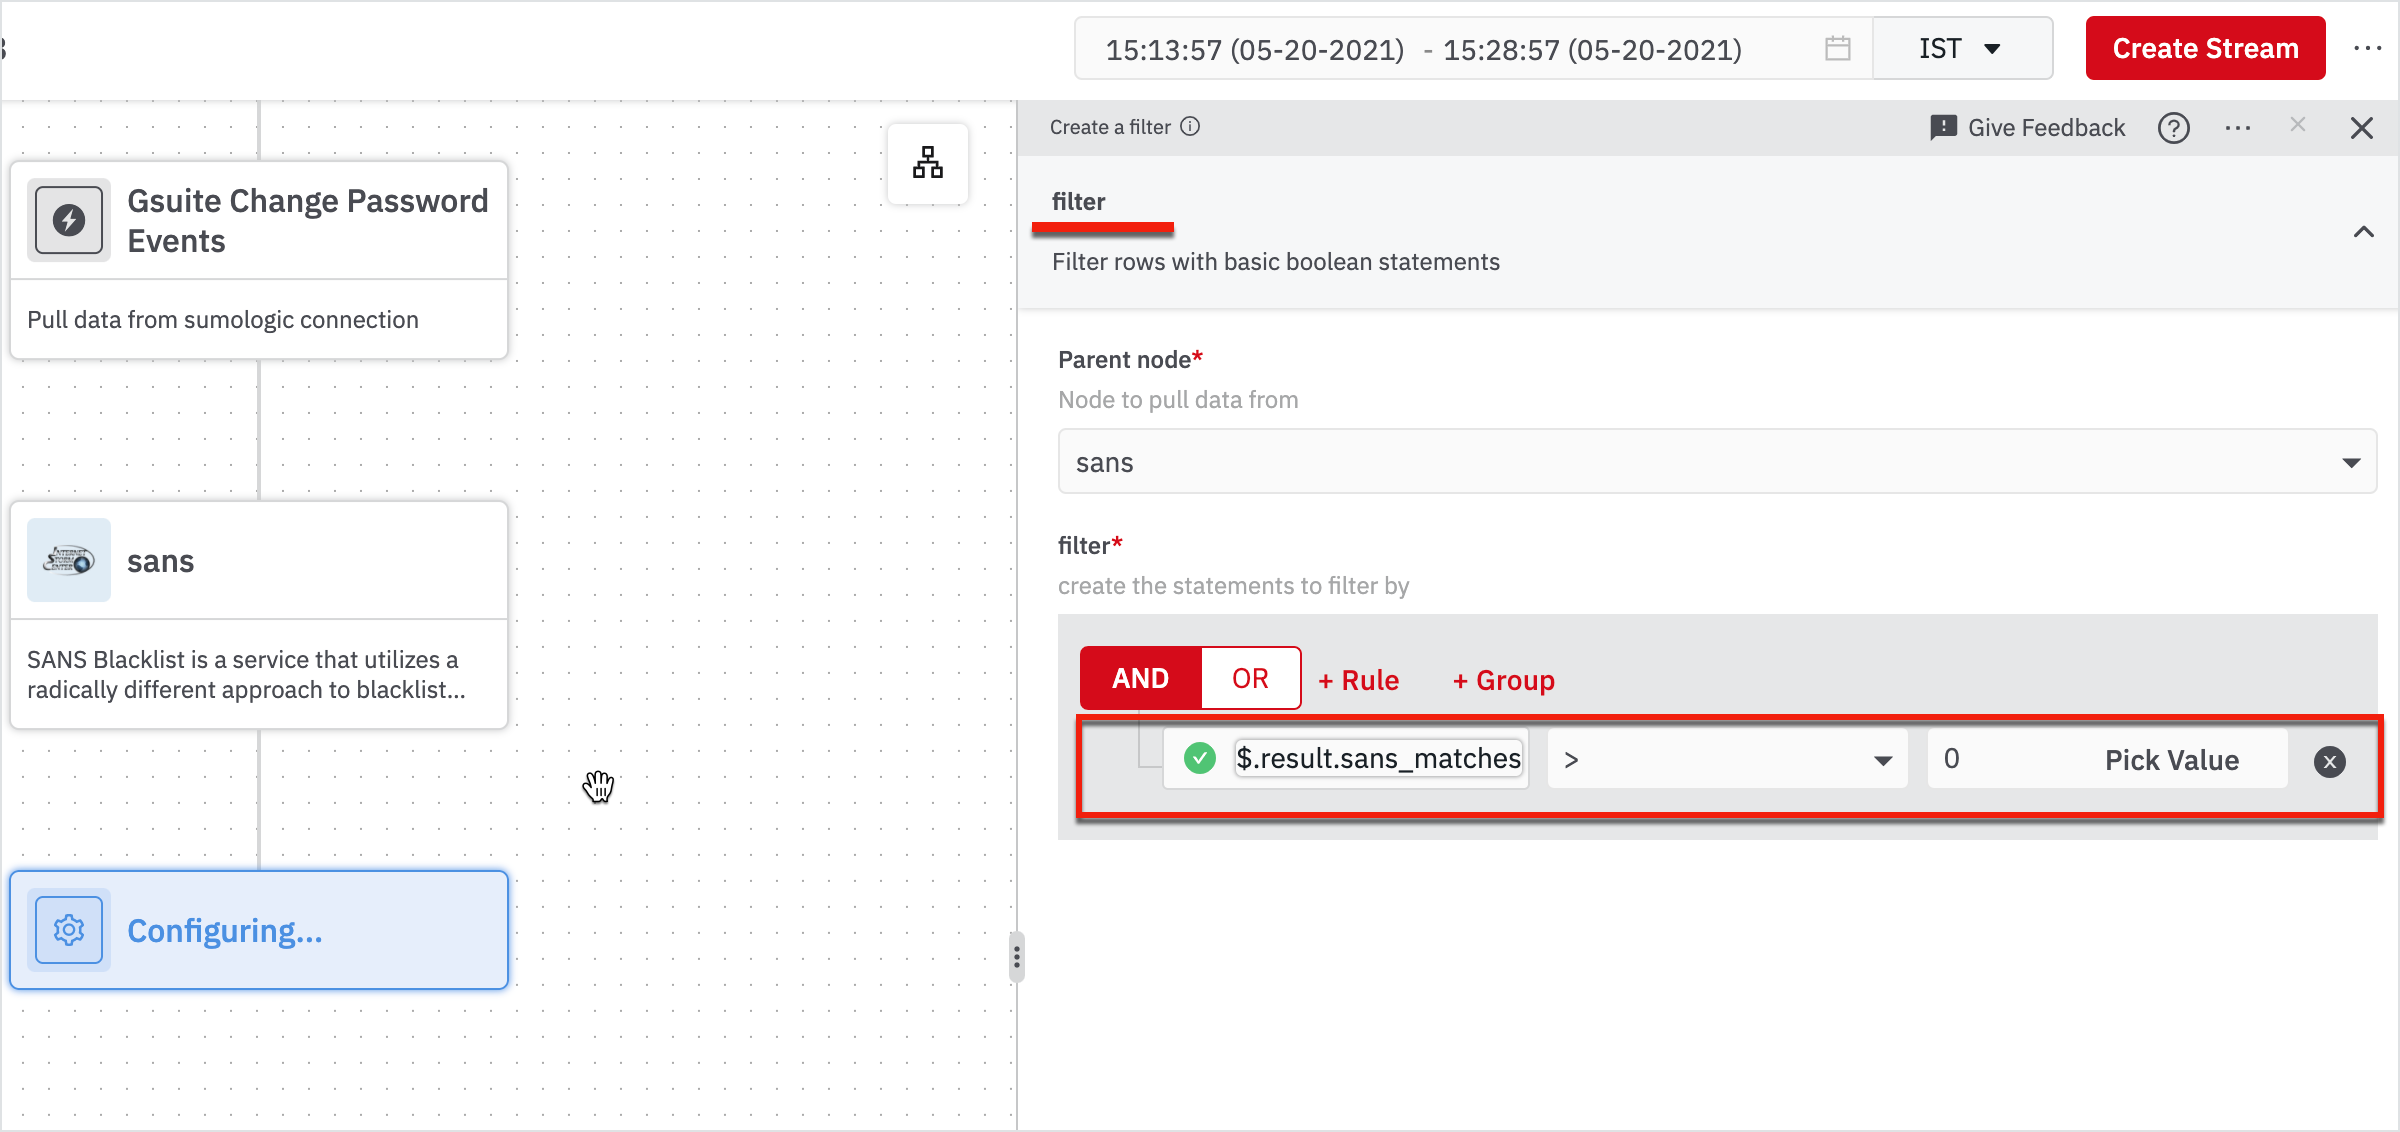
With this node, we can filter out only the bad events that we need to take action on. So we need to filter events with sans_matches > 0.
Enter the value as ‘$.result.sans_matches’ operator as ‘>’ and value as ‘0’ in the right pane and click Run.
Now that we have the actual bad events for the time period we have chosen, we need to convert them into cases in DevoSOAR so that you can track them to take action on them.
- Hover on the node: filter and click on + on the node.
- Search for create case and click Case Management - Create Case in the results.
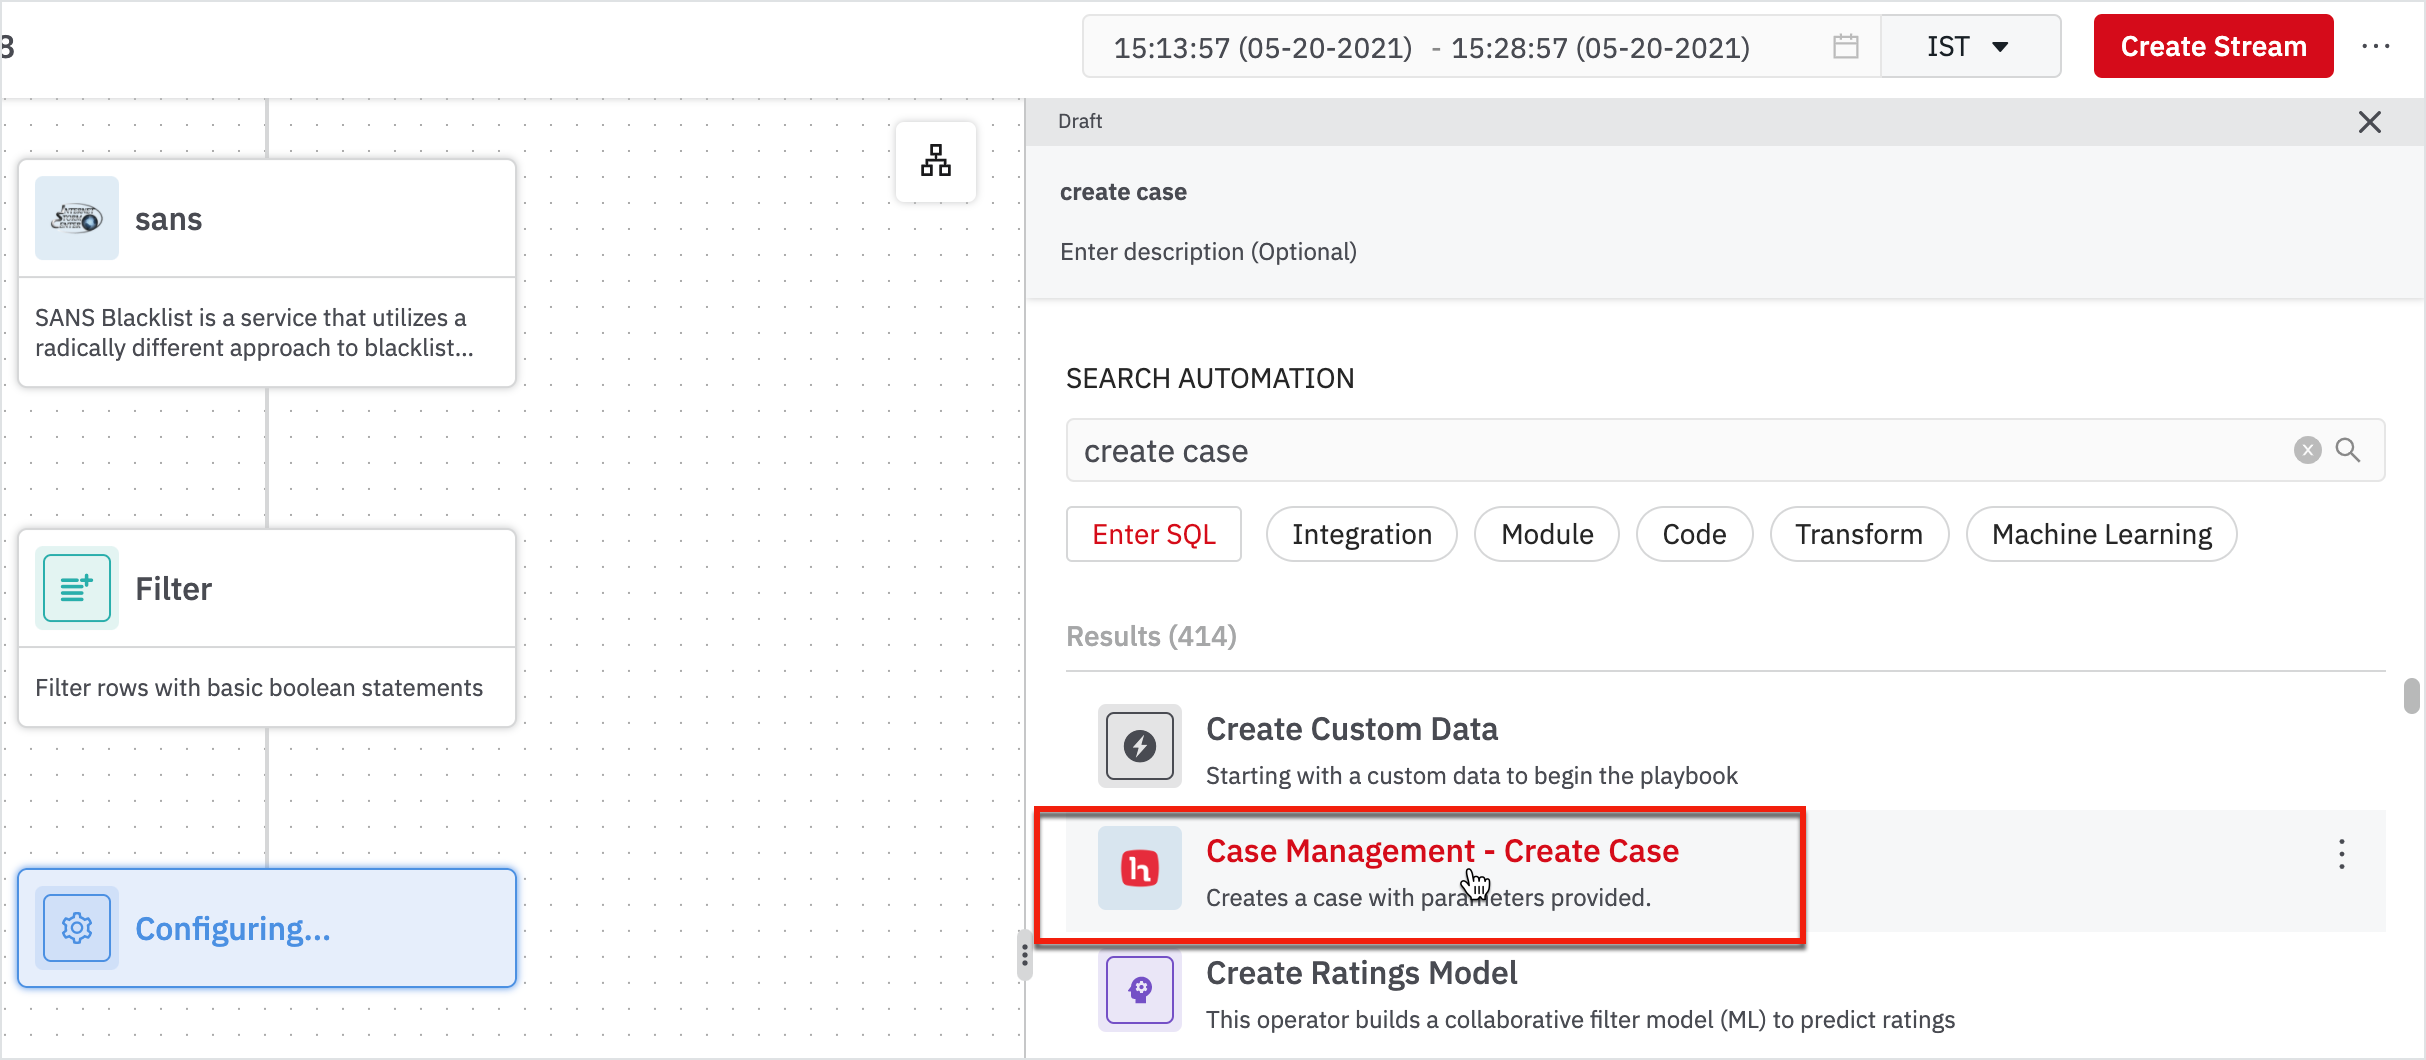
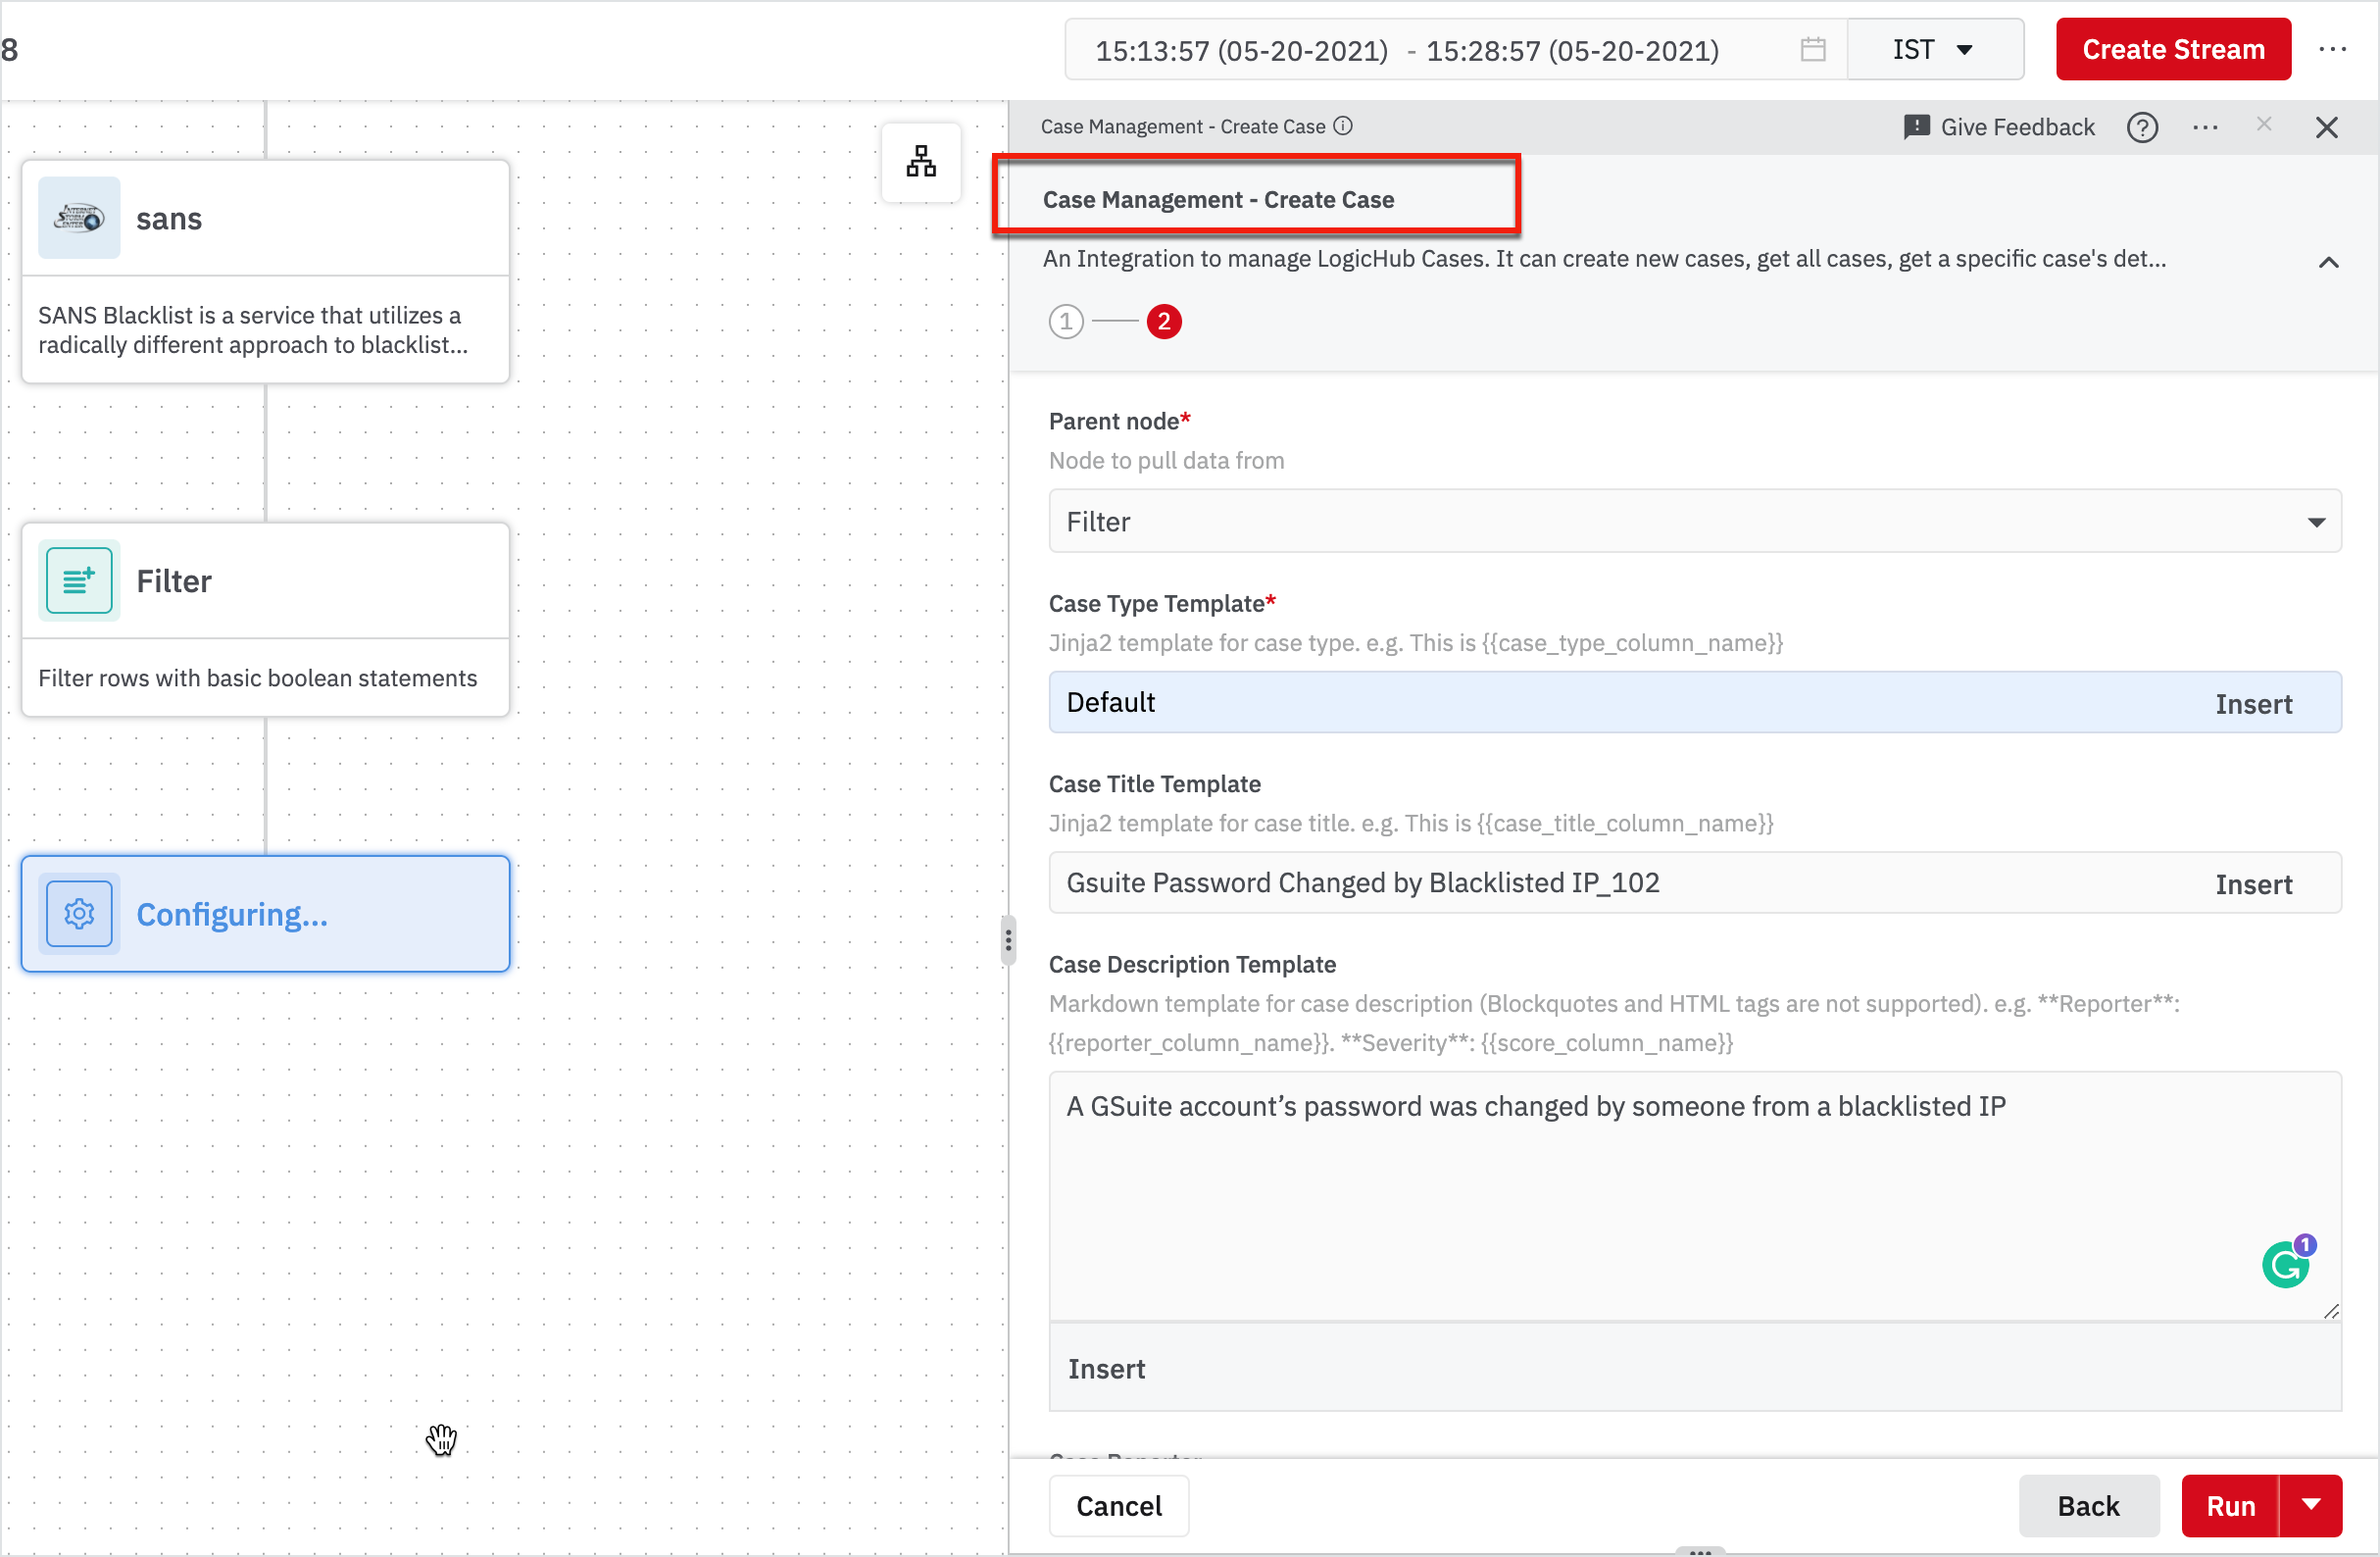
Here, we have to create a case for each identified bad event. Enter the following information in the right pane and click Run.
- Connection: System Integration Connection
- Case Type Template: Default
Optional Fields - Case Title Template: Gsuite Password Changed by Blacklisted IP_102
- Case Description Template: A GSuite account’s password was changed by someone from a blacklisted IP
- Case Reporter: [your name]
- Case Priority: High
Note
You have to click Show Optional Fields in the second page.
Create Streams
Until now, we created a blueprint of logic to identify the bad change password events in Gsuite and convert those into a case. Now we will run this Playbook periodically to create cases automatically as bad events happen. We will schedule a Stream to do so.
Click Create Stream on the top-right corner.

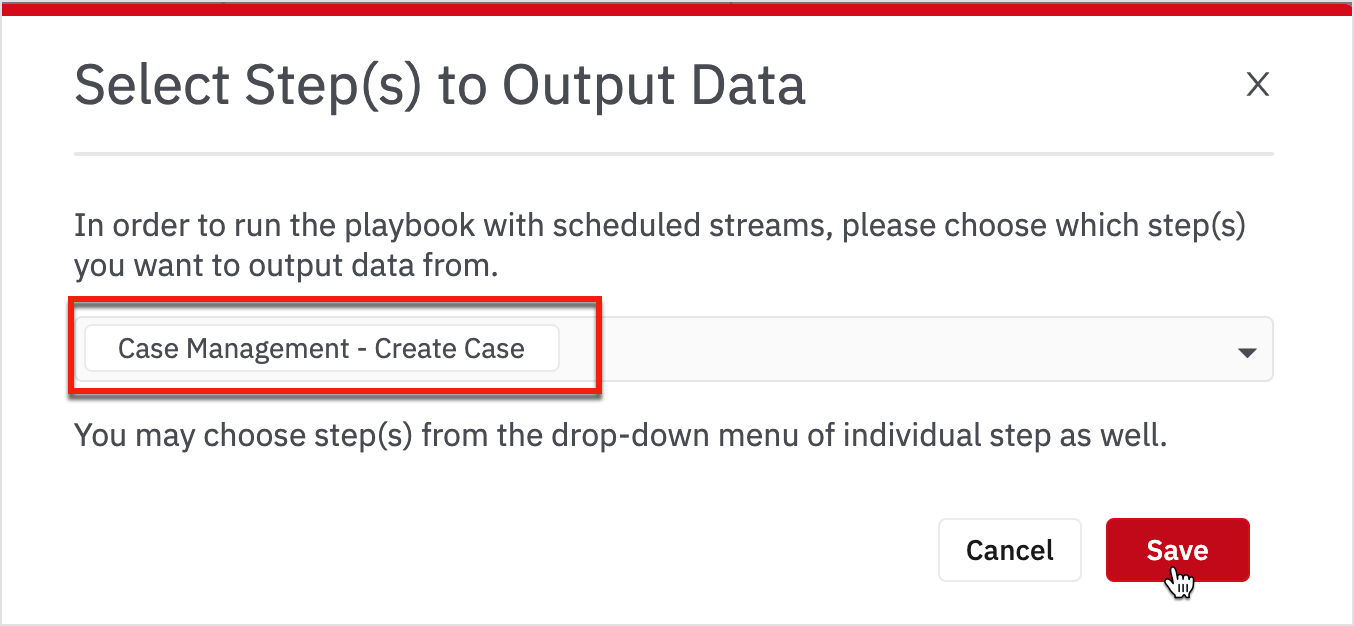
Before you schedule a Stream, you need to define the output of the Playbook. In this case, the node: create case is the output.
Choose the create case from the drop-down and click Save.
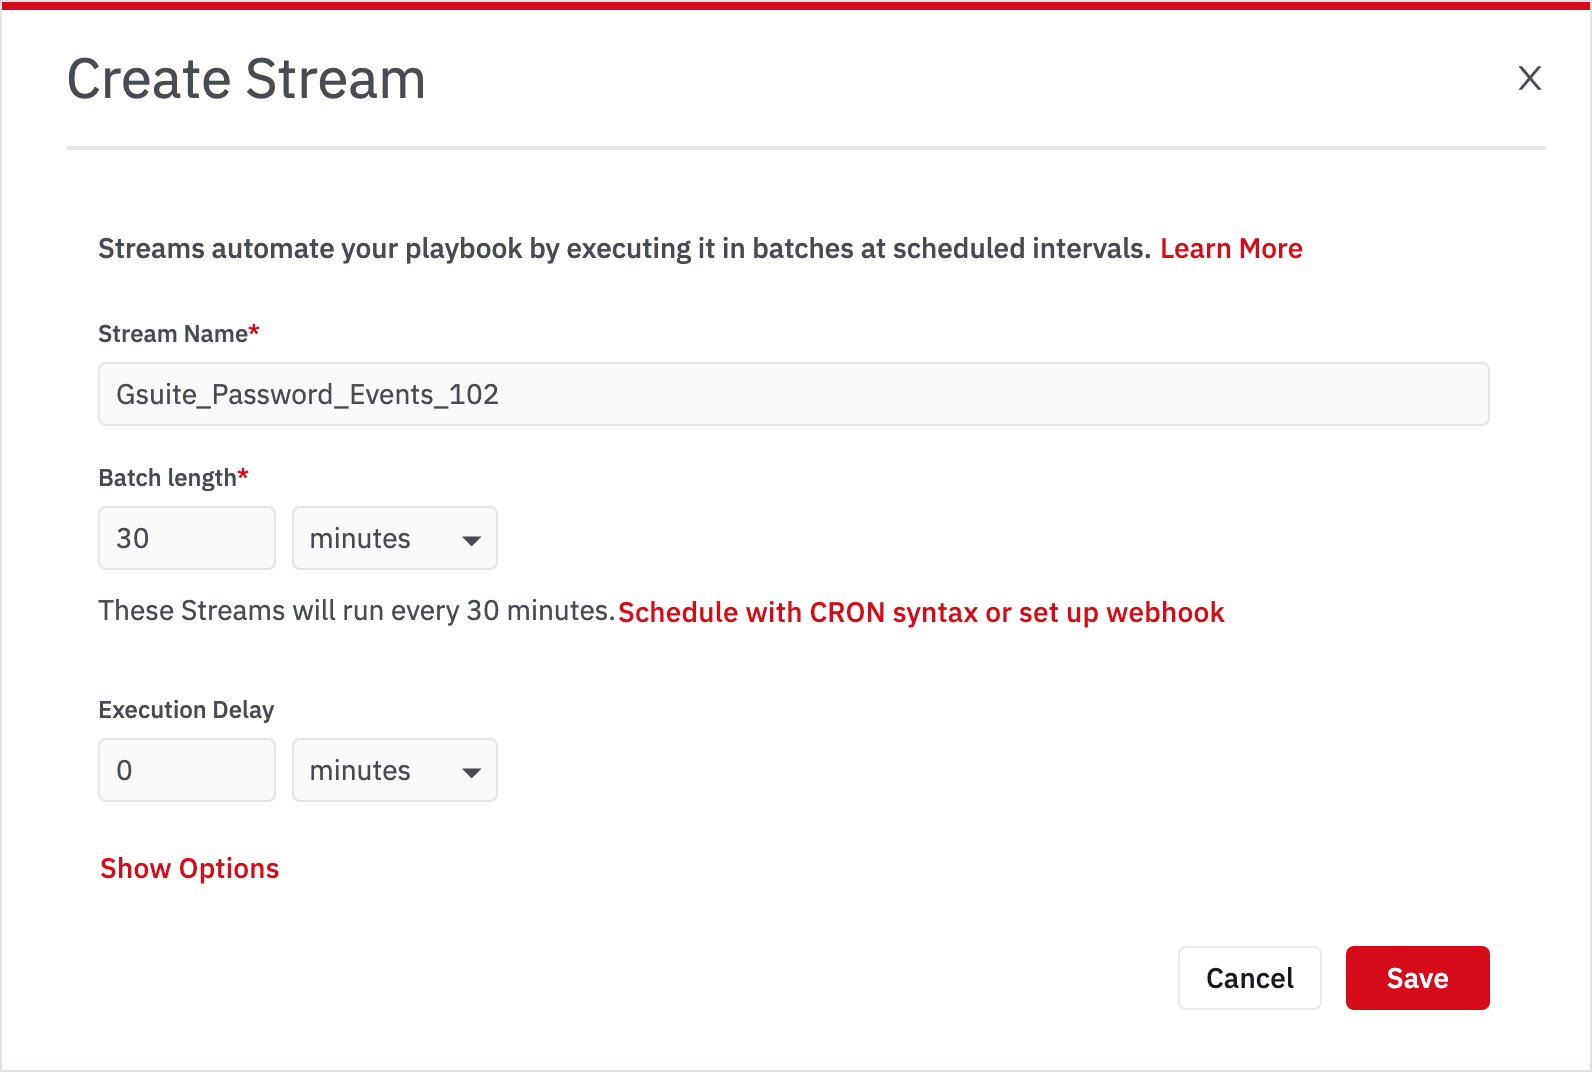
Streams run on events that happened in a time period called batch length. Unless you specify otherwise, the interval between two batch-runs will also be the batch length.
Enter the following information and click Save. (When you create your own Stream, you can choose any name)
Once you have scheduled a stream, you can go to the Streams page to look at the logs of each batch that ran.
- Click Streams page or go to My Library > Streams.
- Click on the stream: Gsuite_Password_Events_102.

- Click on the latest successful batch.

Create a Case
In this page, you can see that there is one row corresponding to one case that was generated for one bad event that happened in the last 15 minutes.
- Go to Case Management > Cases from the left navigation bar.

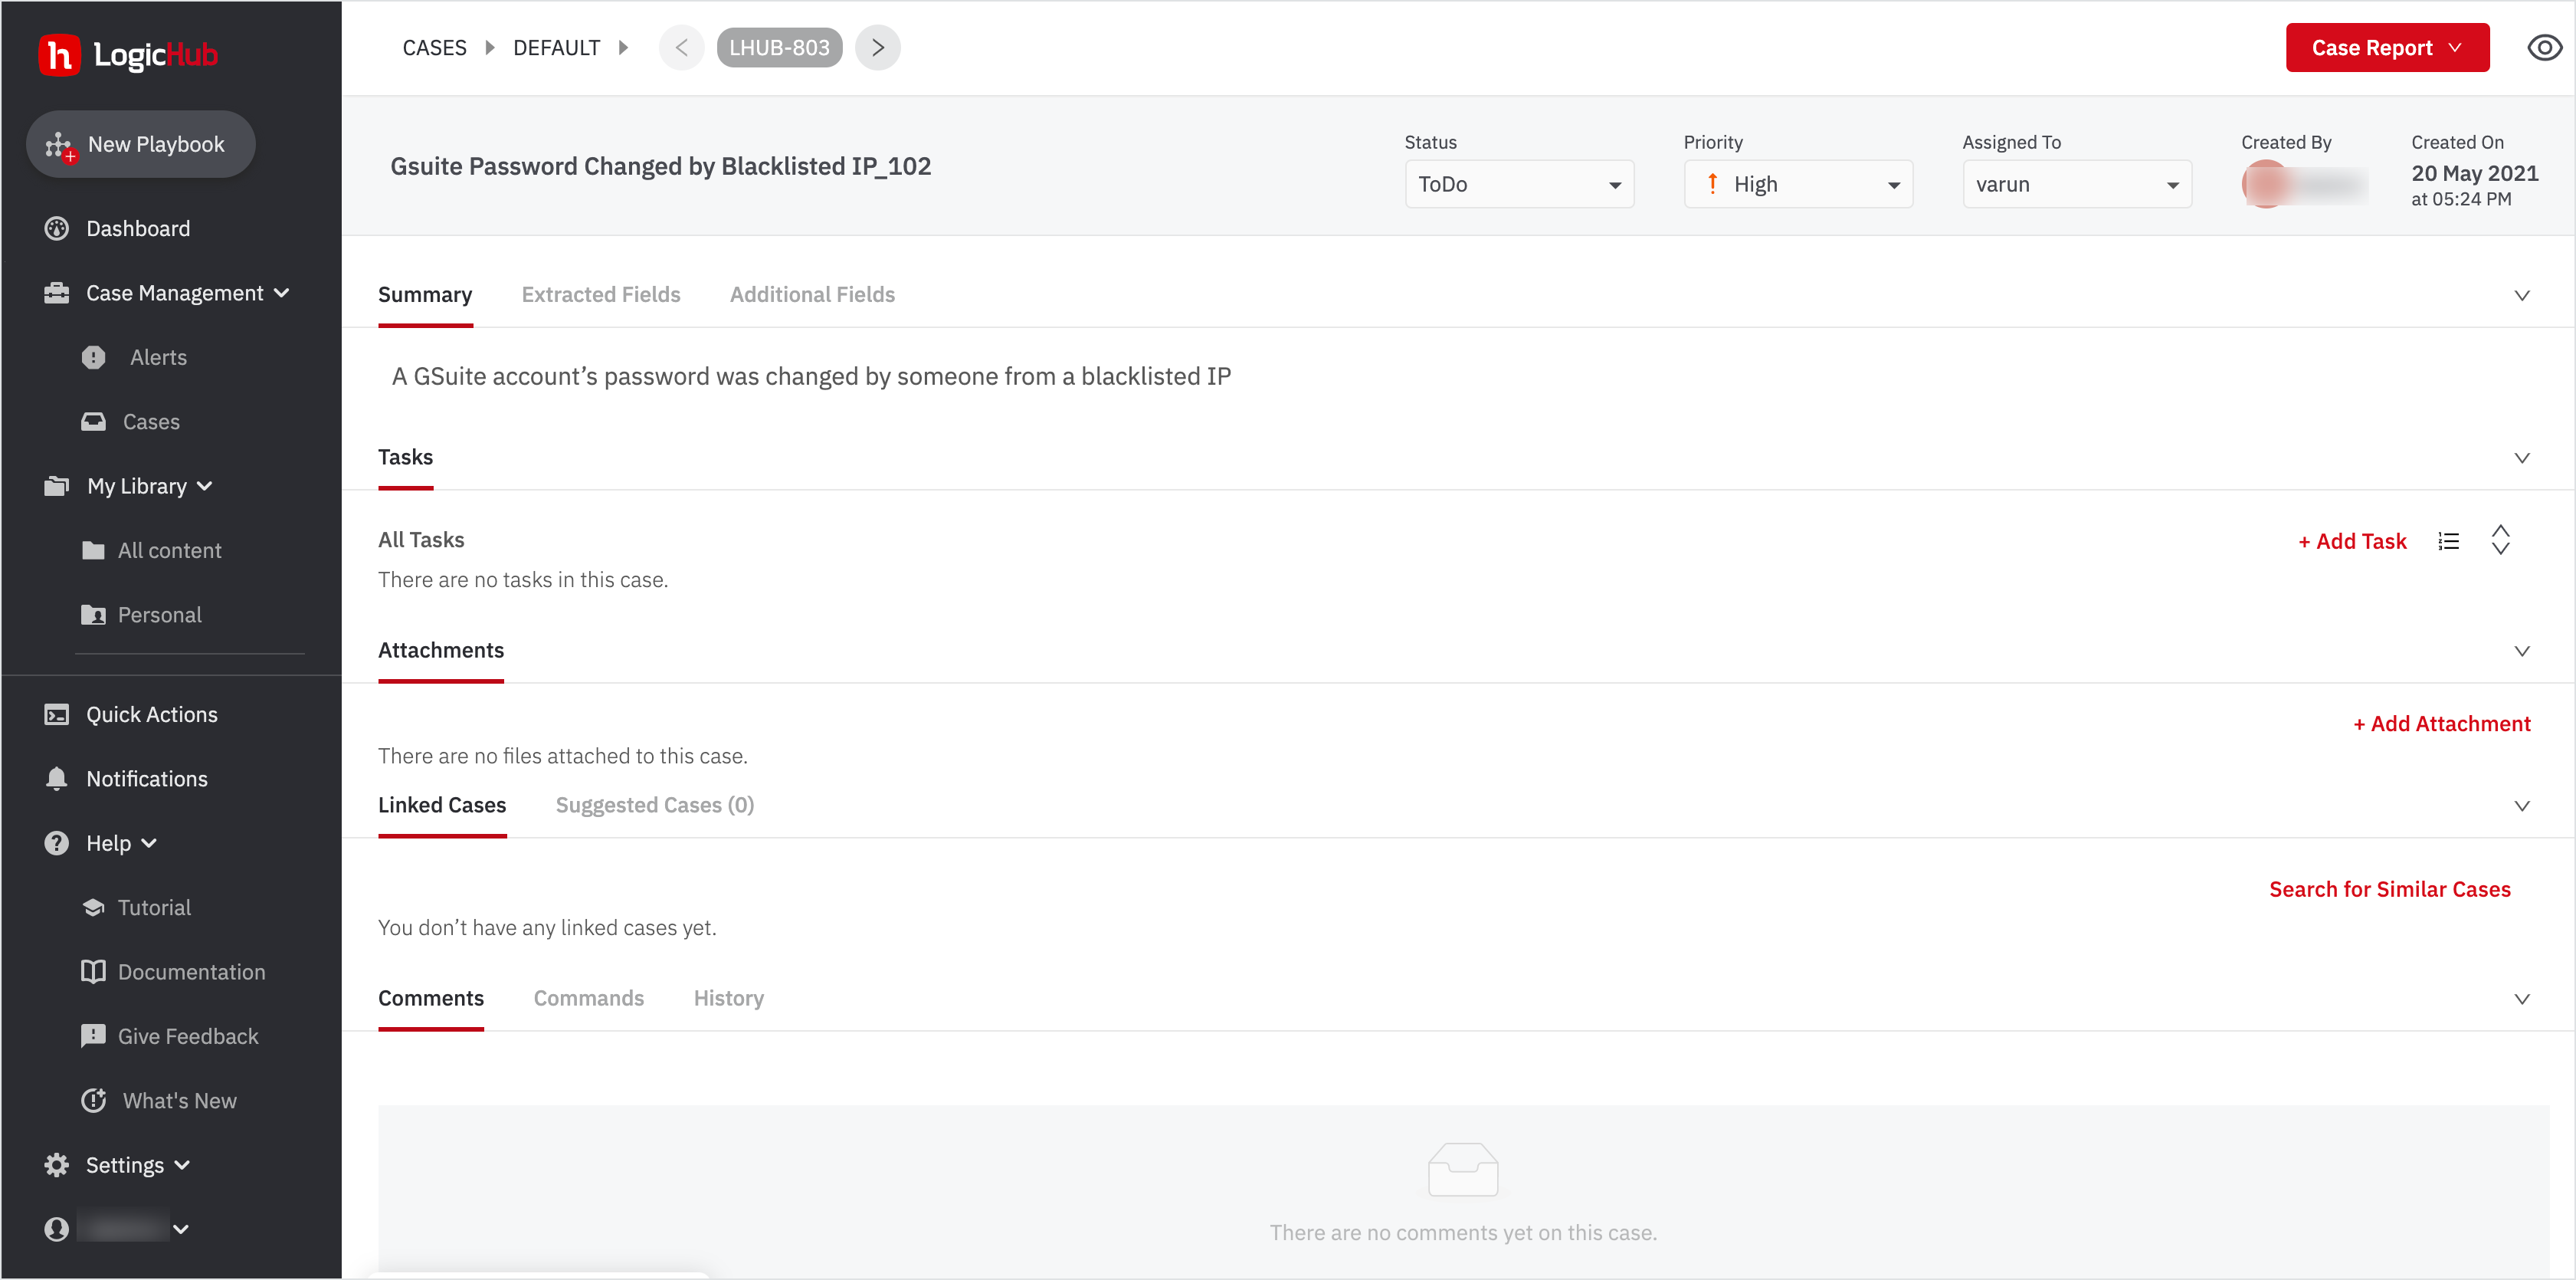
- Click on the case: 'Gsuite Password Changed by Blacklisted IP_102'.
You can add comments and attachments to a case and create tasks to assign to selected users or groups. Additionally, you can:
- Change Priority
- Assign this case to yourself
- Change Status
- Add attachments and so on.
You've Successfully Completed the Steps in Playbook
You have successfully completed the steps in the playbook for identifying the IP addresses that are blacklisted by a threat intelligence organization.
Additionally, you can create a case in LogicHub to track how frequently the password was changed from a blacklisted IP.
Let’s look at another example of how to build an email phishing playbook.
Phishing Playbook
The email phishing triage is one of the most commonly implemented use cases because it’s a combination of two of our significant focus areas: automation and threat detection.
To begin with:
- Go to My Library > Playbooks.
- Click New on the playbook page or click New Playbook from the left navigation.
- Select a New Blank Playbook.
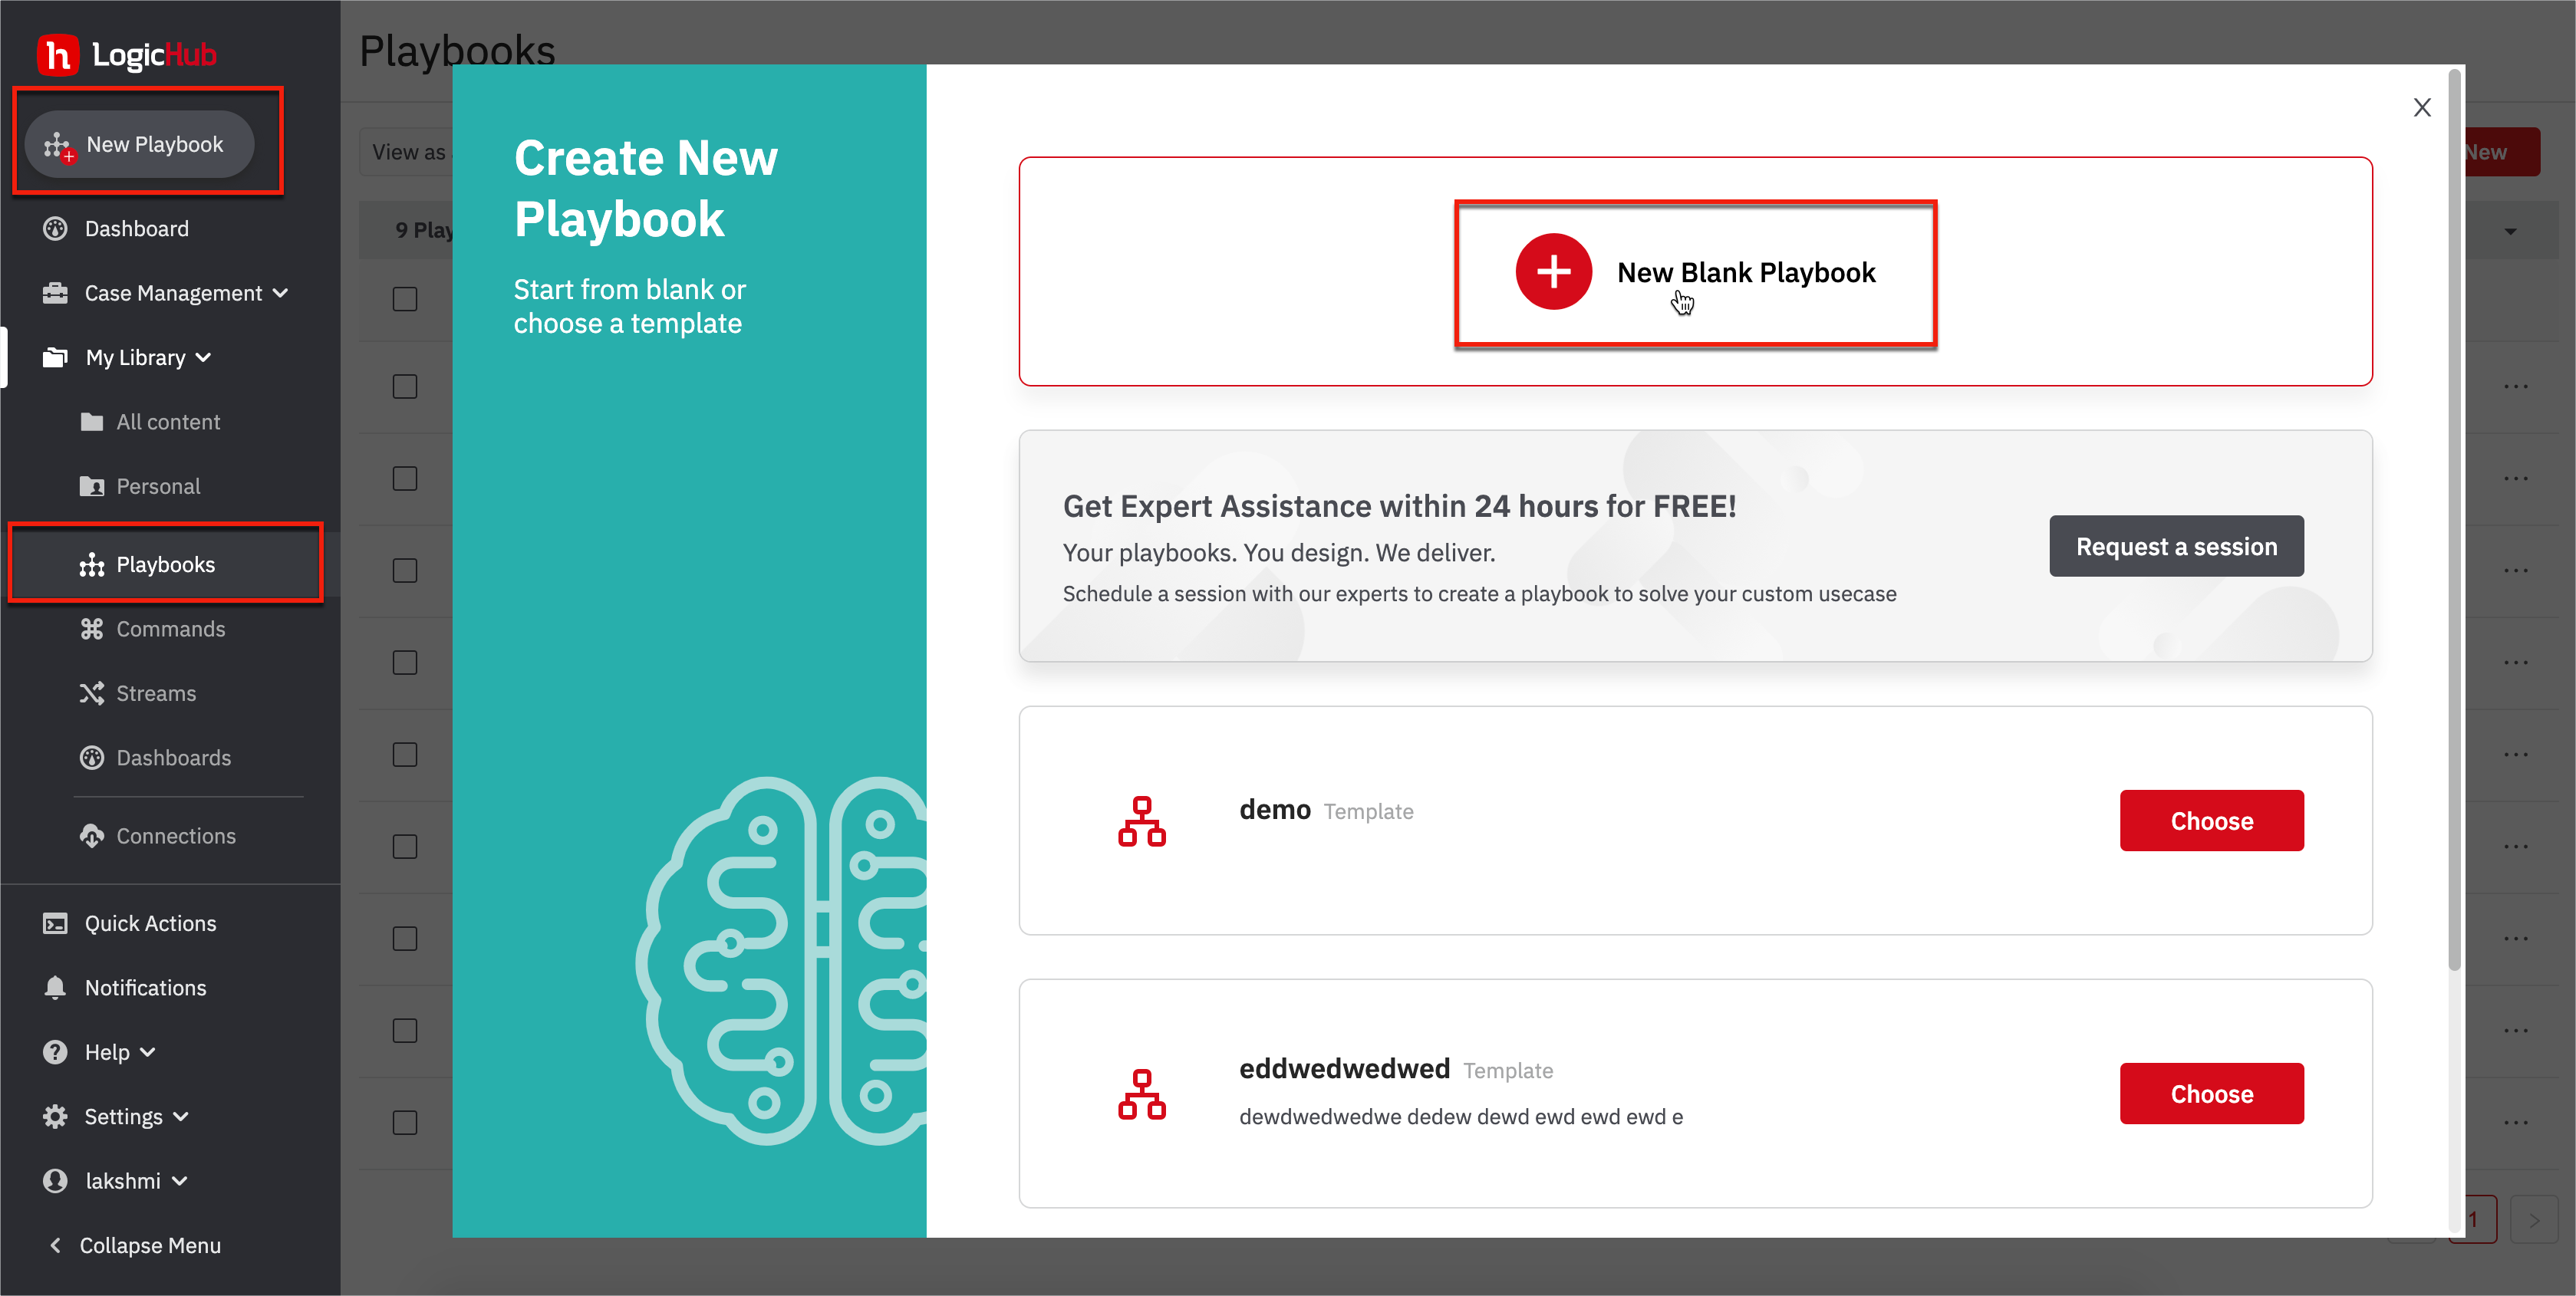
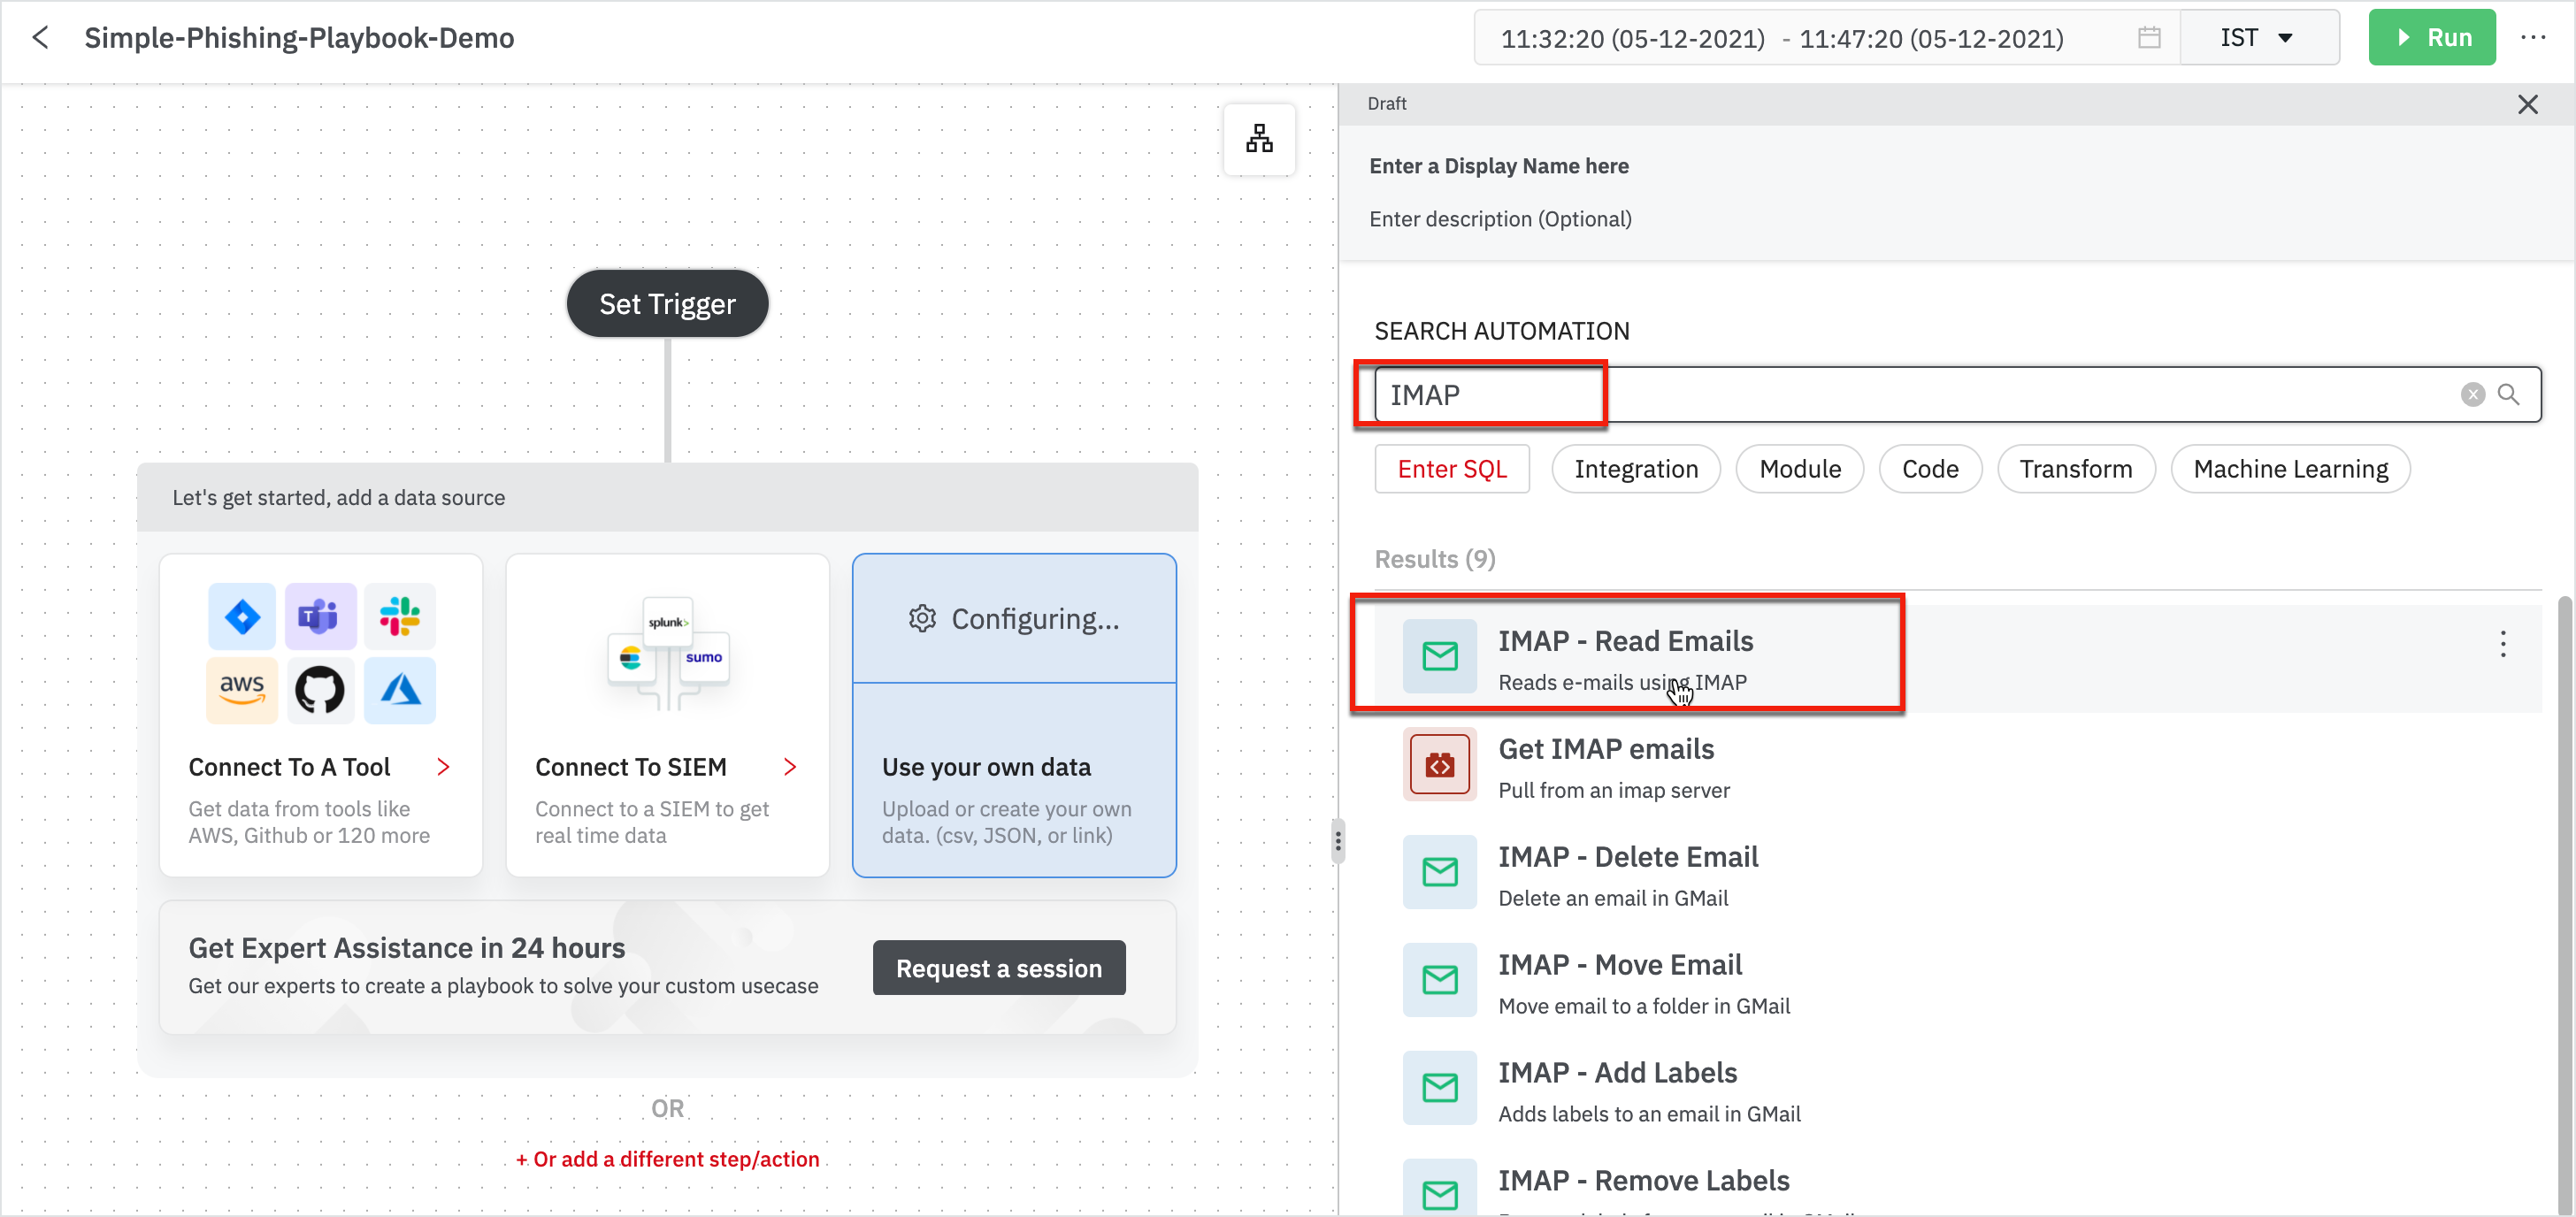
- The first thing is to fetch emails; add automation 'Fetch Emails’ that gets you the emails. Search for IMAP and look for IMAP - Read Emails.
- A connection has to be established to DevoSOAR. We have a Gmail account set up where I have sent many emails reported to be phishing. The connection is already set up to that Gmail account.
- Enter the name of the folder (Inbox) and choose to read ALL emails and in the optional fields, enter the Filtering: Message Limit to be filtered.
With the help of automation, we are talking to Gmail connection, pulling in all the email data represented as JSON format.
What are the next typical steps that DevoSOAR recommends? Choose from the Recommendations or you can also search for the next steps to automate your data.
- The next step is to Parse Emails that would be useful for phishing.
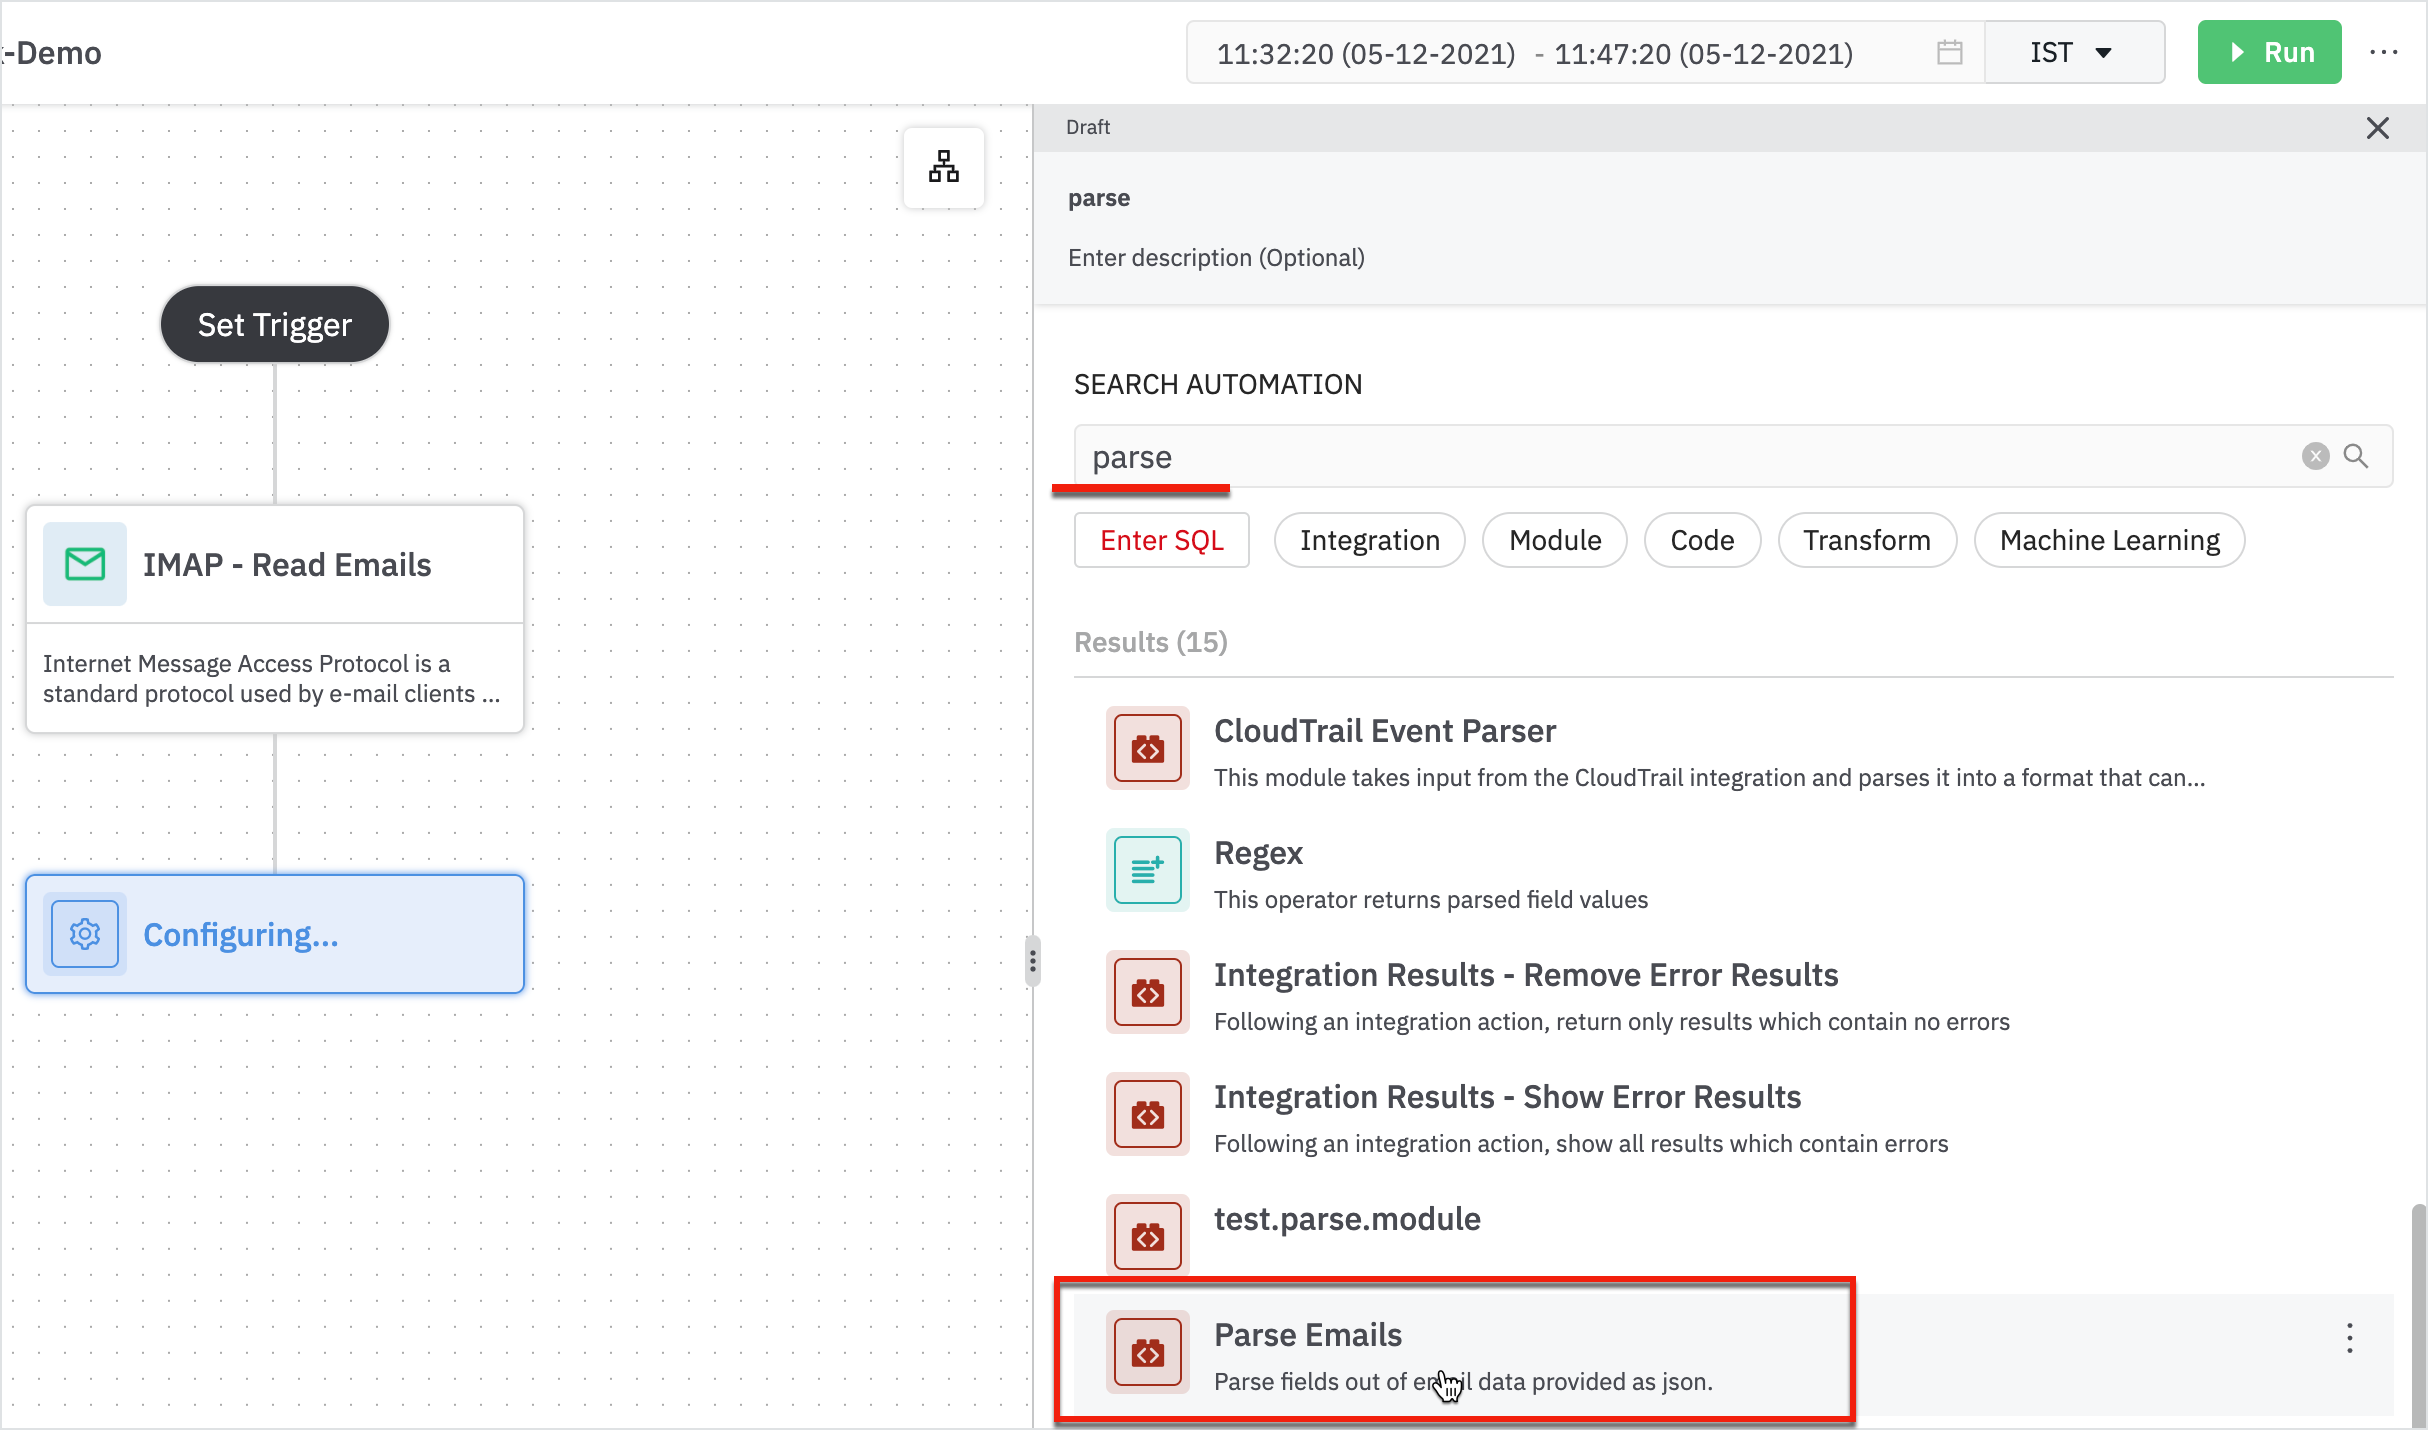
Enter the following details in the parse email form:
- Parent: The node from which it is sourced from.
- Email Column: Column containing email data as JSON
Note
Read Emails need a connection to assist from outside. Parse Emails are modules that help you automate simple steps. For example, it parses out details such as count, attach, email from, cc, subject, message-id, and so forth.
- Next, let’s look at the URLs from email and figure out if the emails are suspicious or benign using ‘Extract URLs from Email’.
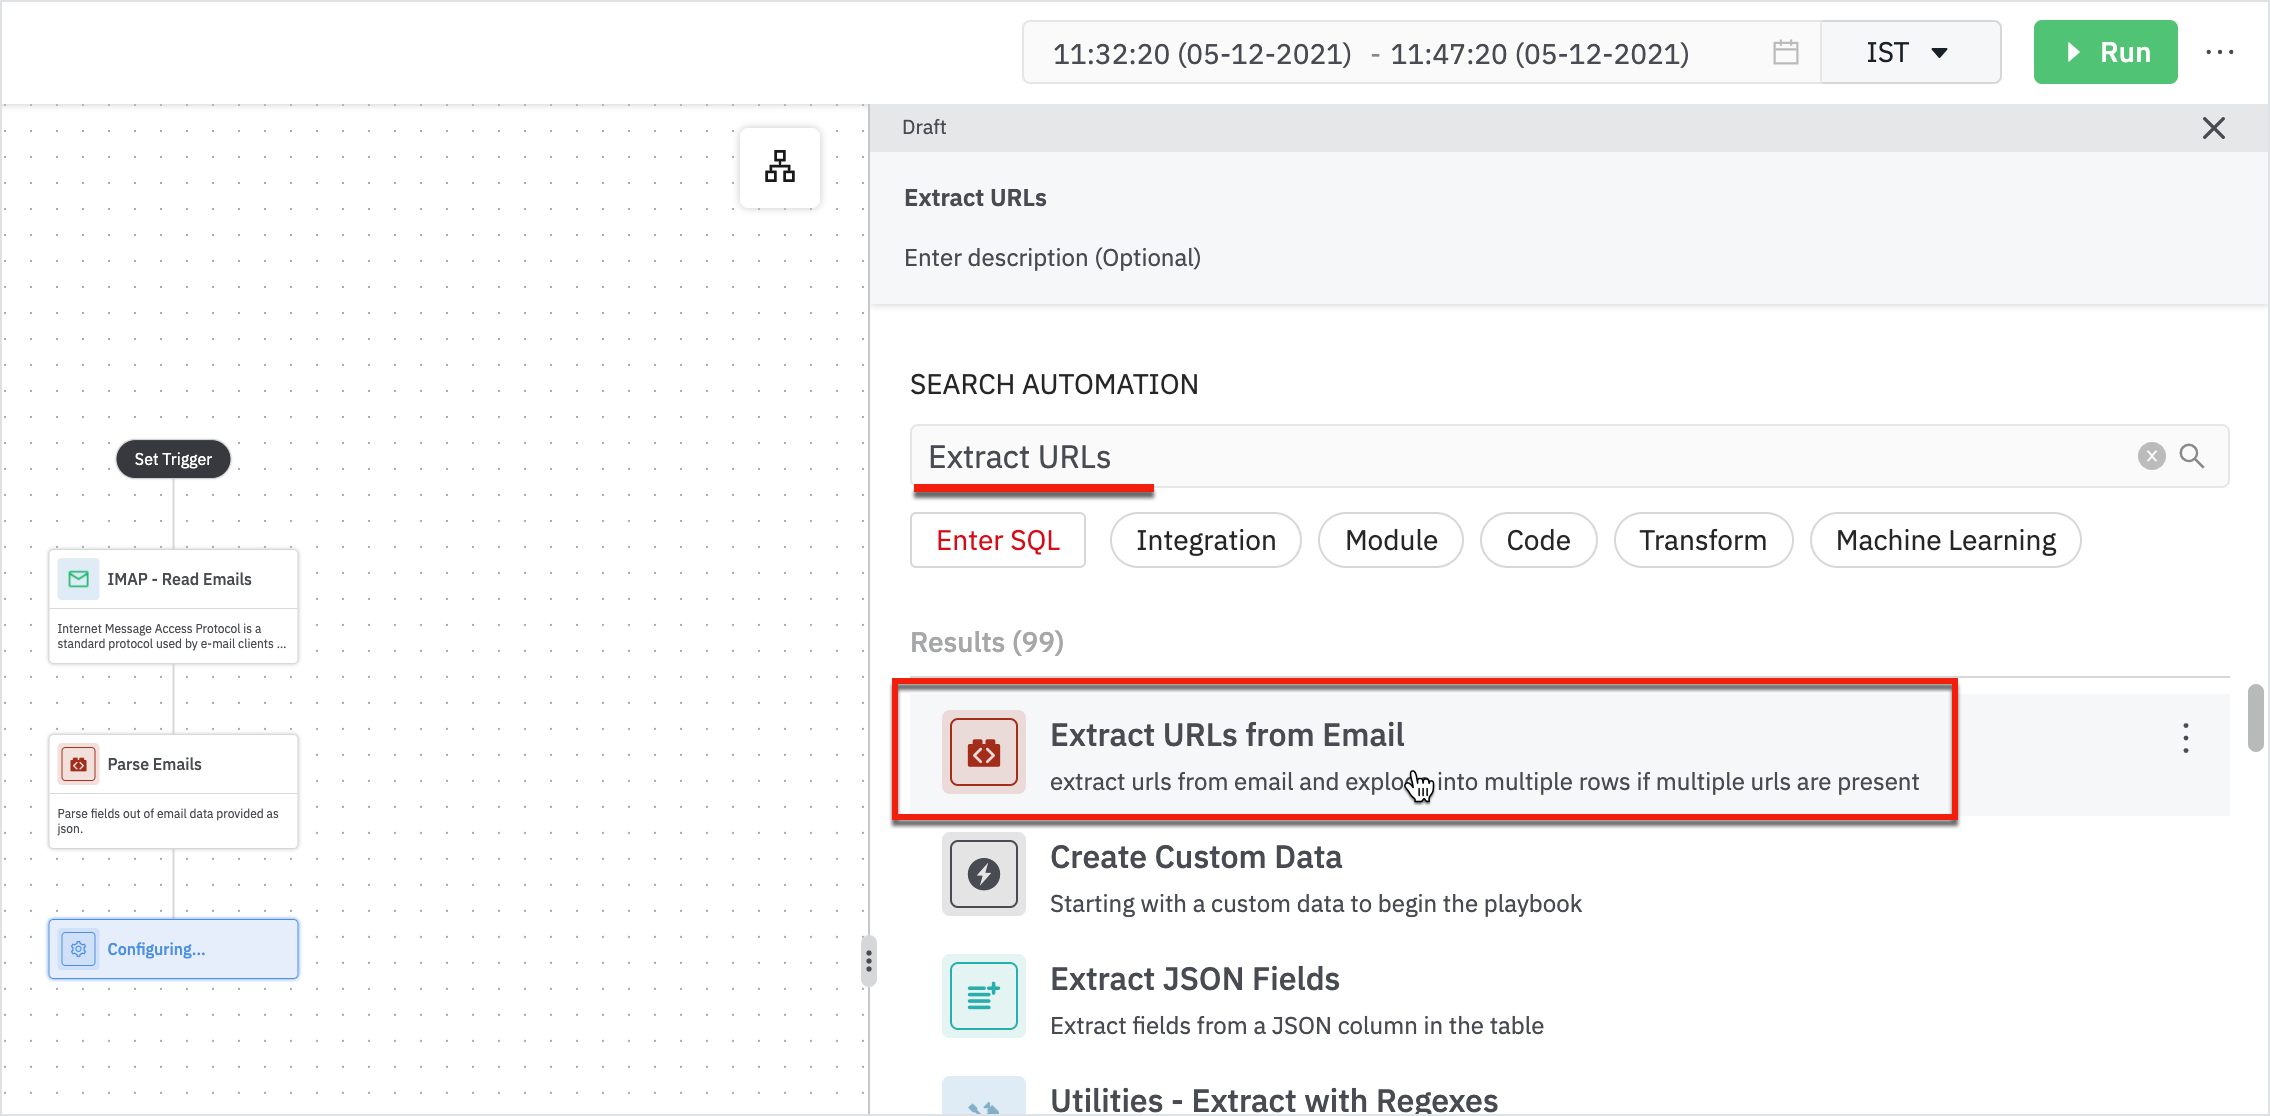
Enter the following details in the extract URLs from the email form:
- Parent: Parent node will be ‘parse emails’.
- Email Column: Column containing email data as JSON.
The result displays all the extracted URLs from the emails.
Once we’ve extracted the URL, the next step is to talk to the webroot.
- Add a step to analyze the URL using ‘Score URL using Webroot’ and parse the result that webroot senses and assign it a score. If the URL is greater than 8, then the URL is suspicious.
We have to build a connection to the webroot.
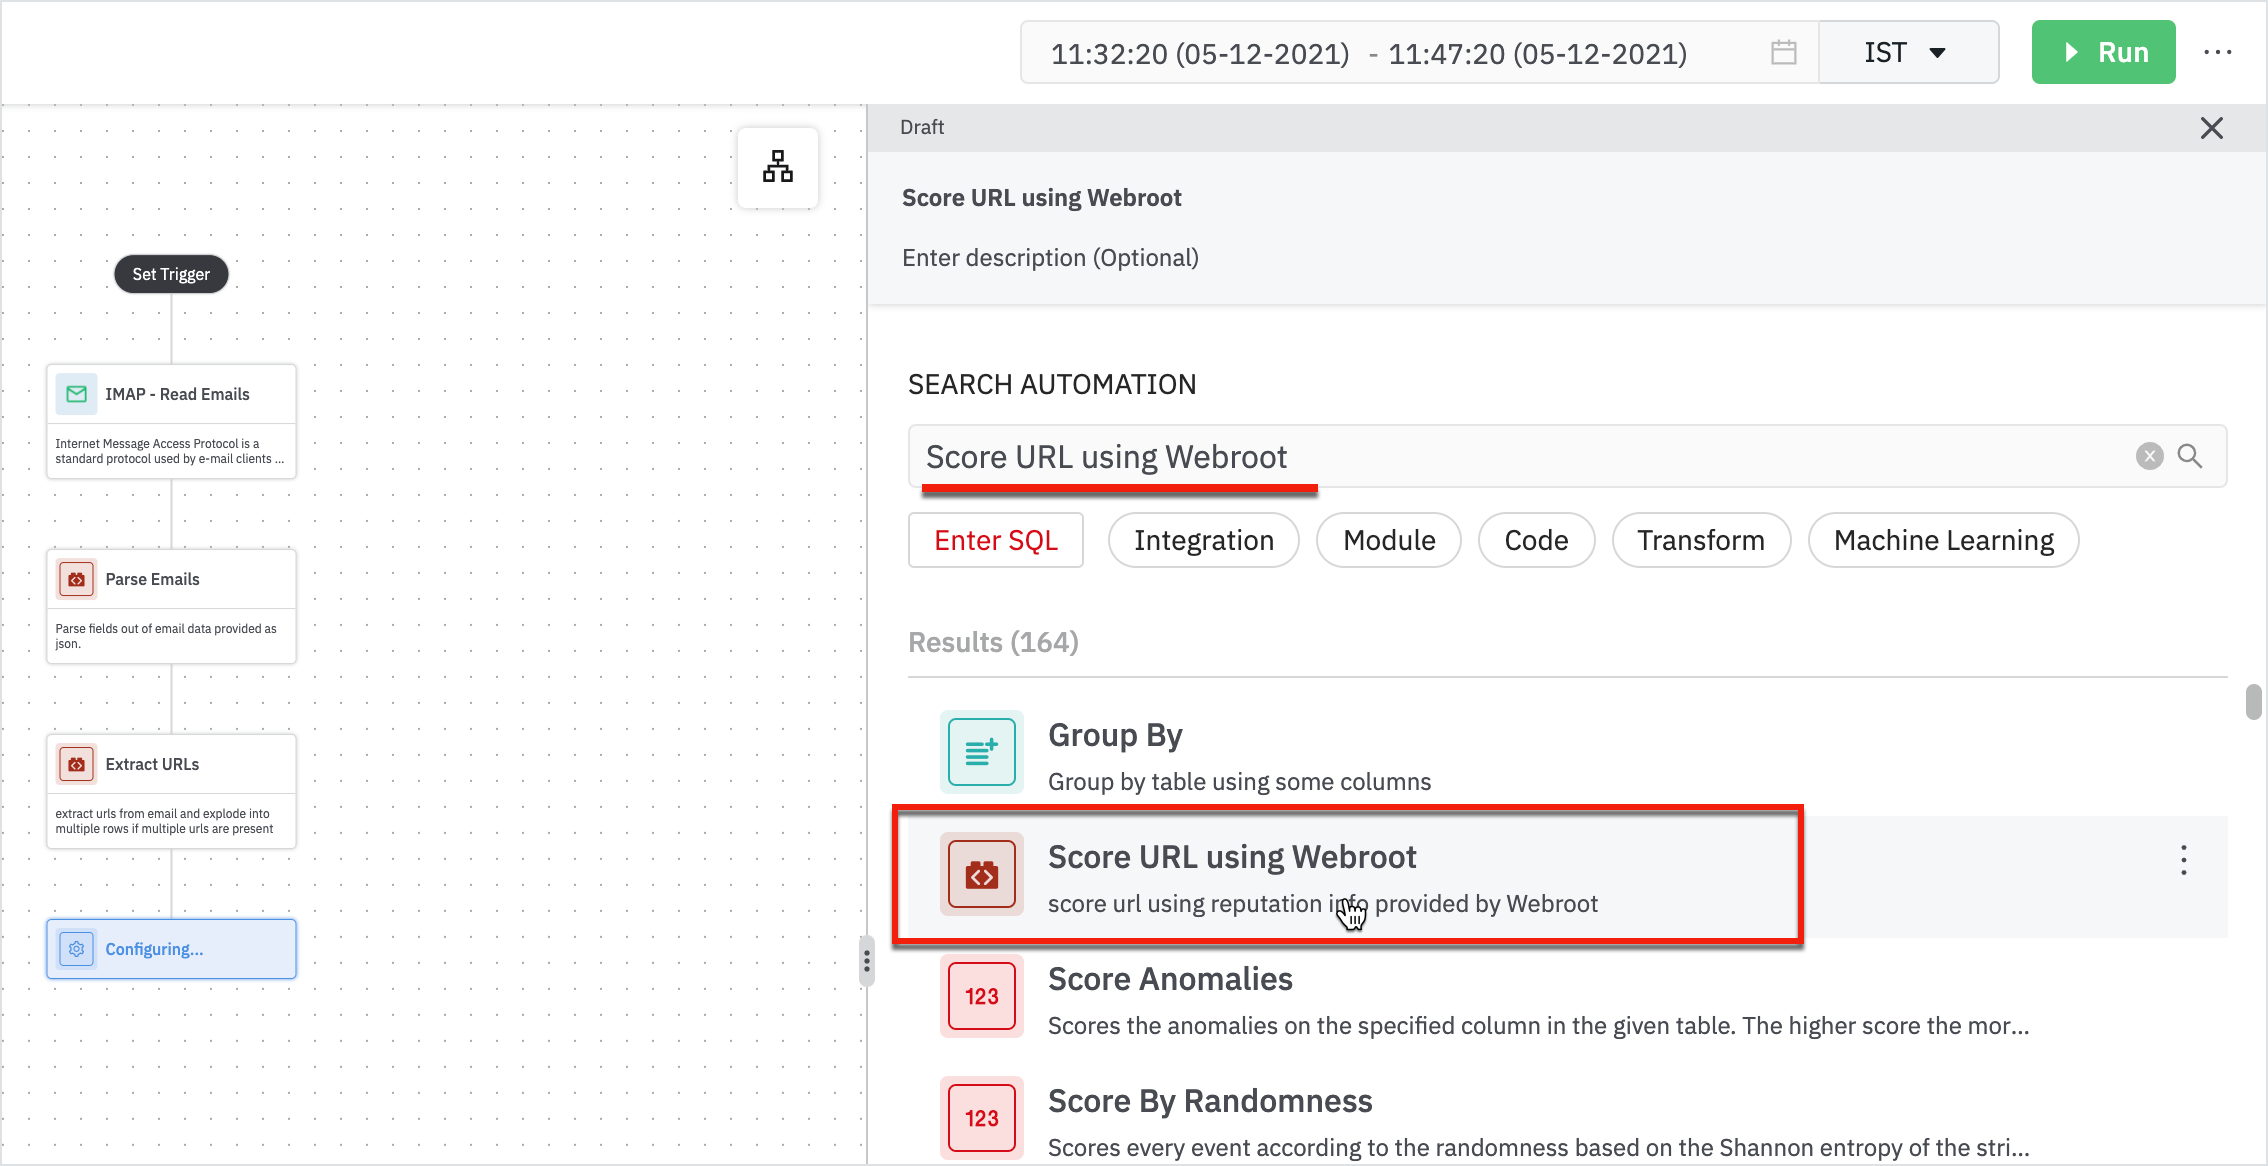
Enter the following details in the Score URL using Webroot form:
- URLs: Table containing URL as a column.
- URL Column: This is the URL column.
- Click Next.
- Add a webroot connection and click Run.
And now the result displays the filtered emails out of which most of them have URLs and scores.
We looked at the URLs on a score of it, you can do the same thing with attachments.
- Add another step to filter out attachments using ‘Filter Emails with Attachments’.
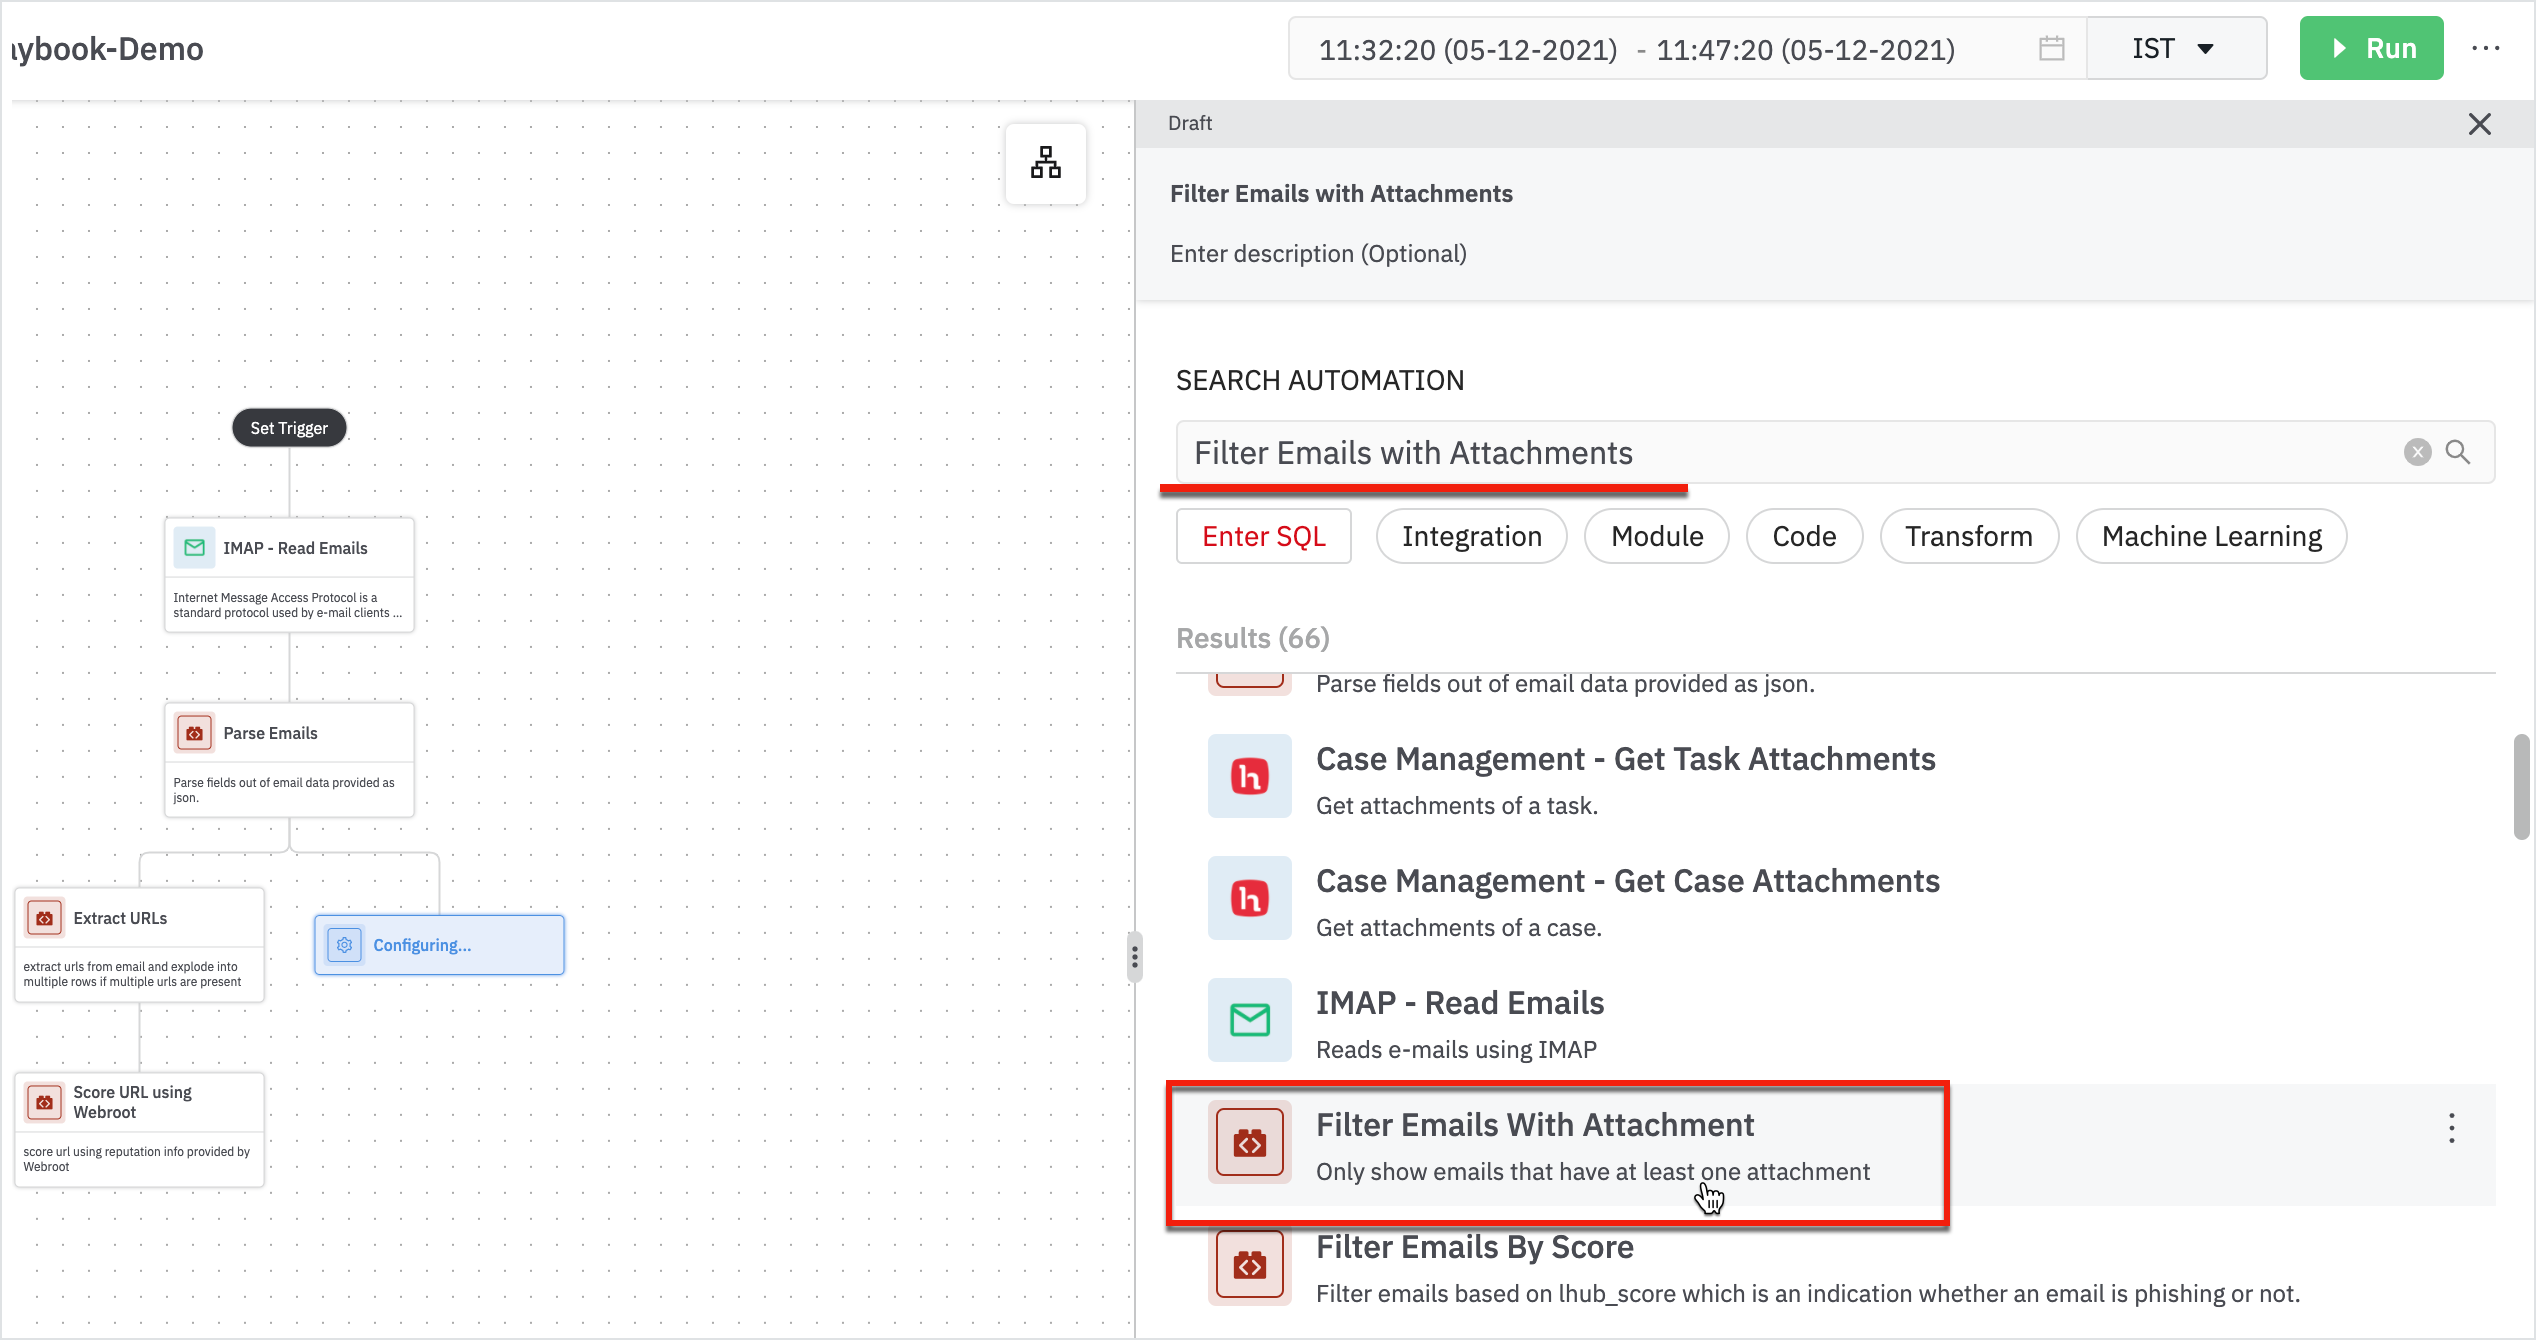
Enter the following details in the Filter Emails with Attachments form:
- Parent: Parent node will be Parse Emails
- Attachment Count Column: Column containing the number of attachments for an email: attach_count
When the result is displayed, it shows the number of attachments. Extract the attachment and send it to the threat intelligent service.
- Extract the attachment using ‘Extract First Attachment from Email’.
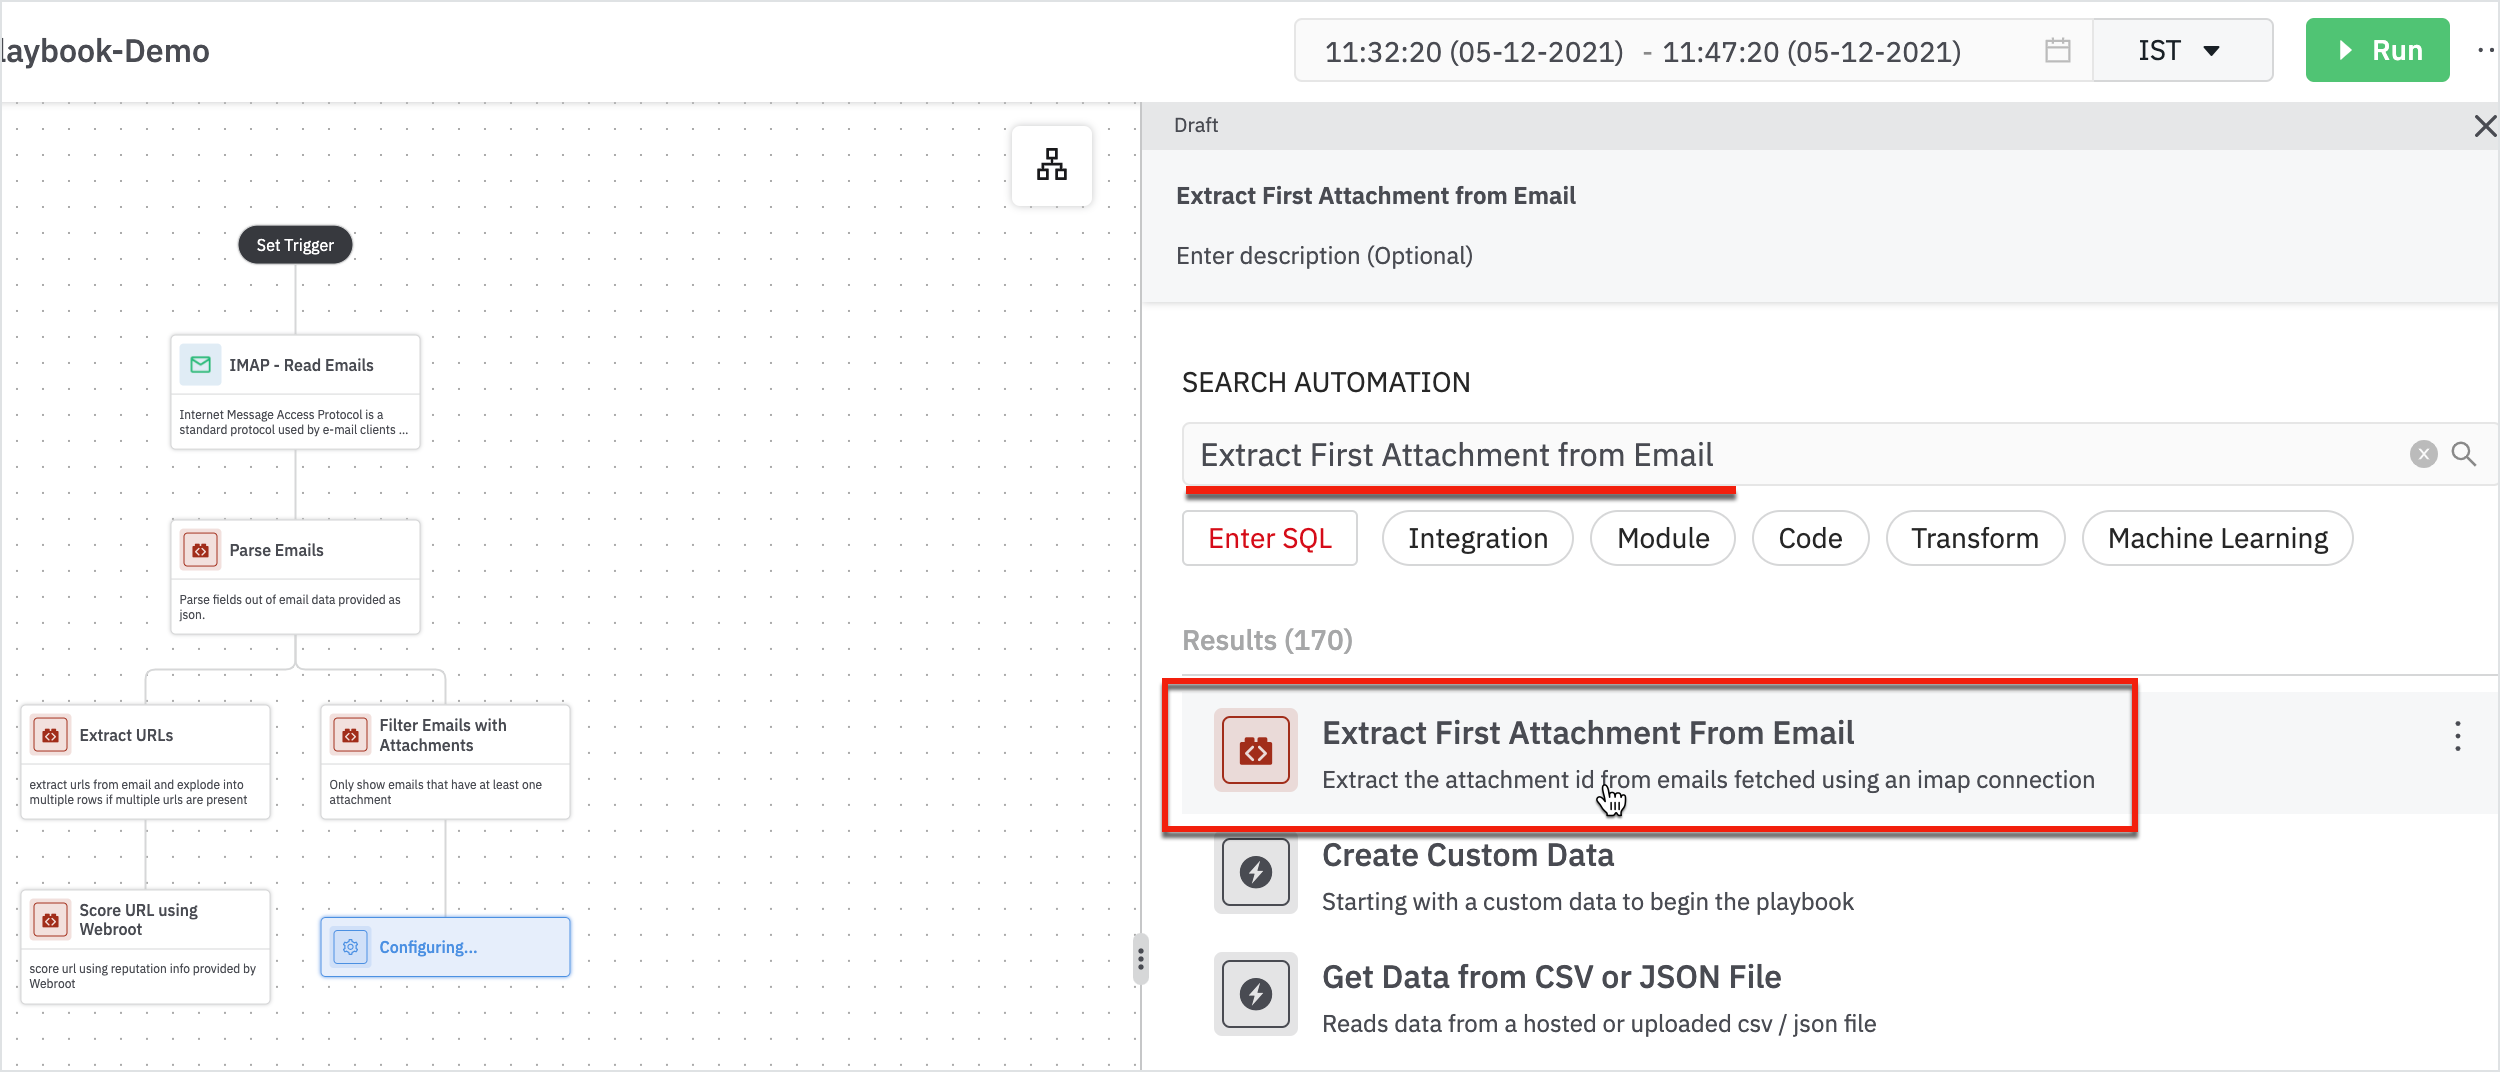
Enter the following details in the extract first attachment from the email form:
- Parent: Parent node will be Filter Email with Attachments
- Email Result Column: Column containing email data as JSON (result)
The results will be displayed with the attachment ID. Before we send the attachment, we need to calculate the MD5 of the file.
- Add next step using ‘Enrich with MD5 and Sha of the File’.
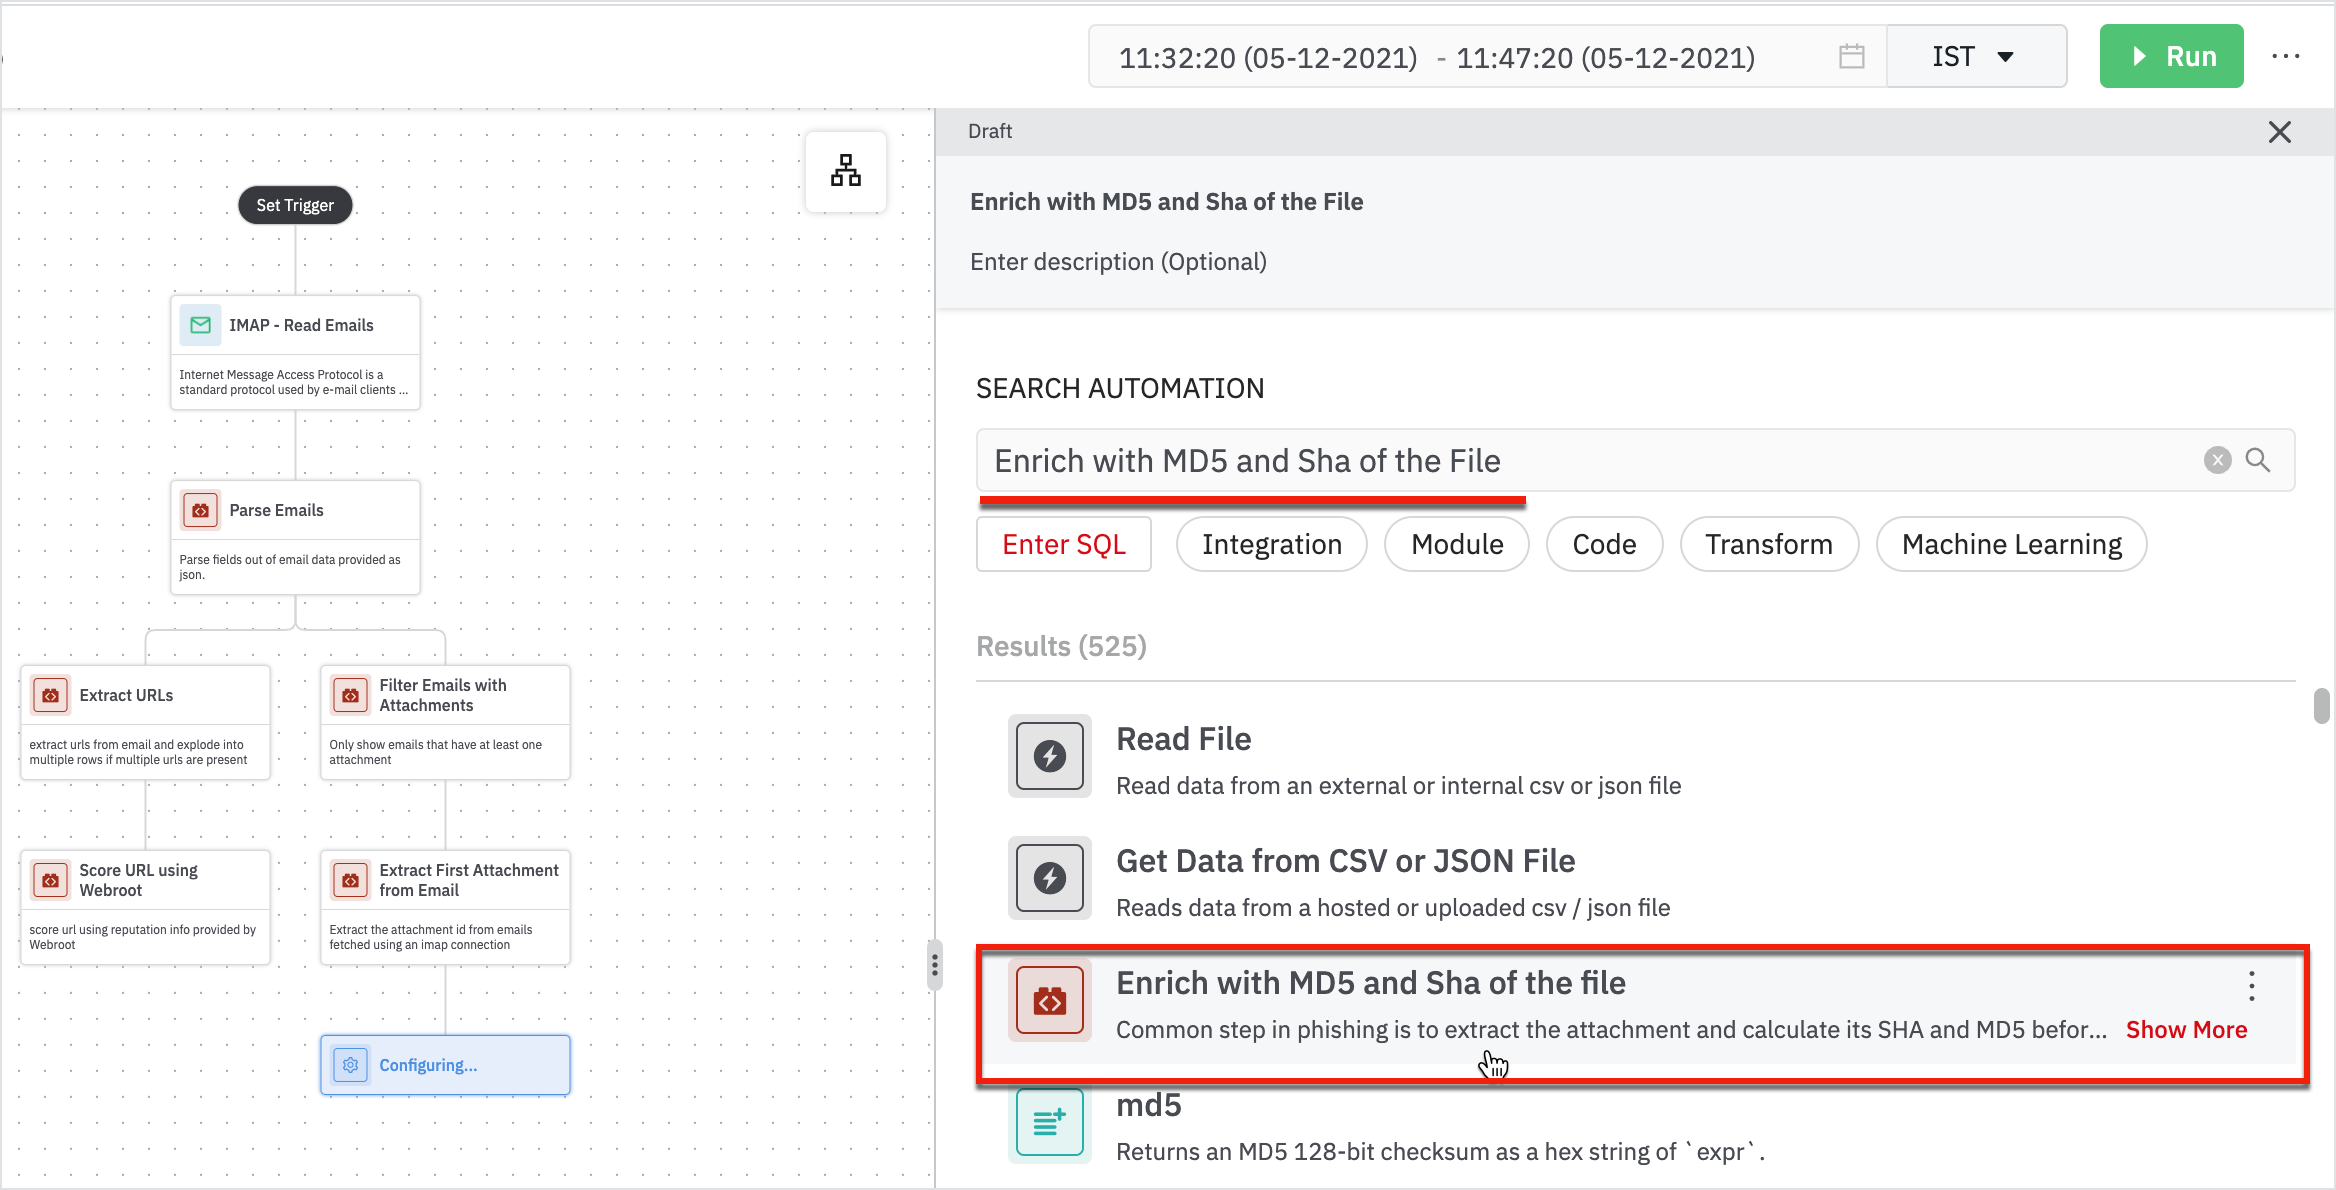
Enter the following details in the form:
- Parent: Parent node will be 'Extract First Attachment from Email'.
- Attachment ID Column: Column containing attachment ID.
- Click Next.
- Add a connection for File Tools integration and click Run.
We have the MD5 and Sha results displayed.
- Add a step to pass the file with webroot using ‘Webroot File Reputation Score’.
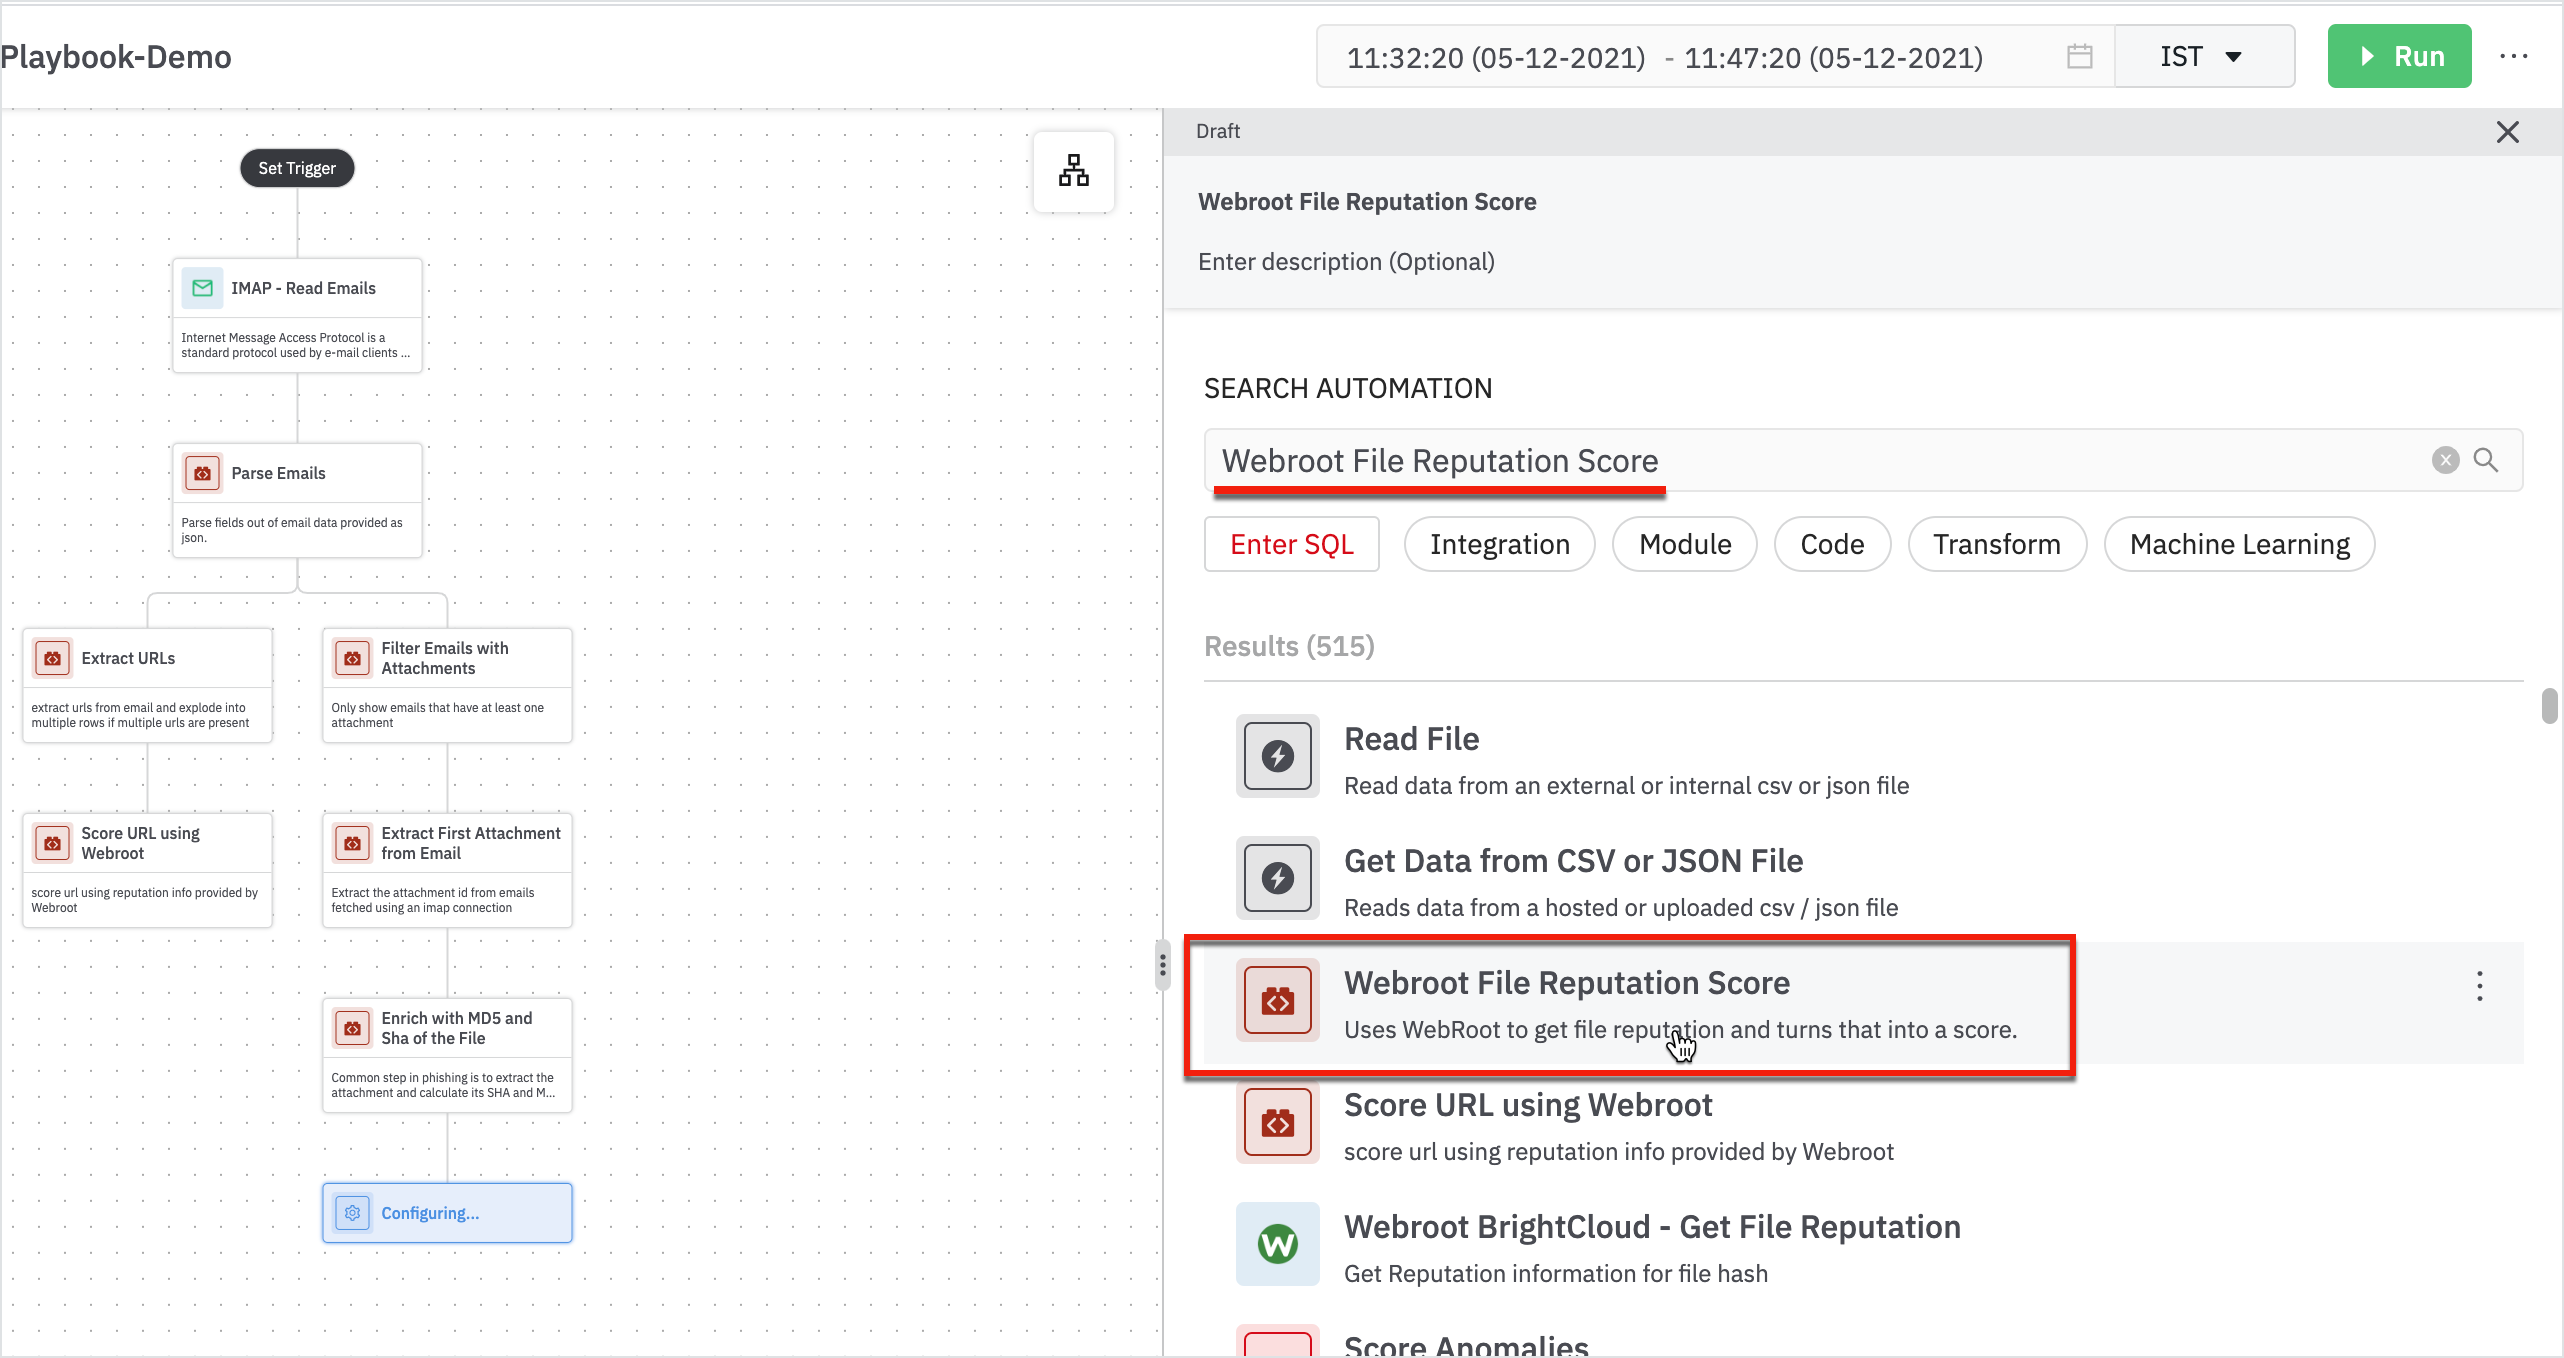
Enter the details in the Webroot File Reputation Score form:
- Parent: Parent node will be Enrich with MD5 and Sha of the File.
- Hash Column: Column containing hash (md5) of the file.
- Click Next
- Add a connection for Webroot BrightCloud integration
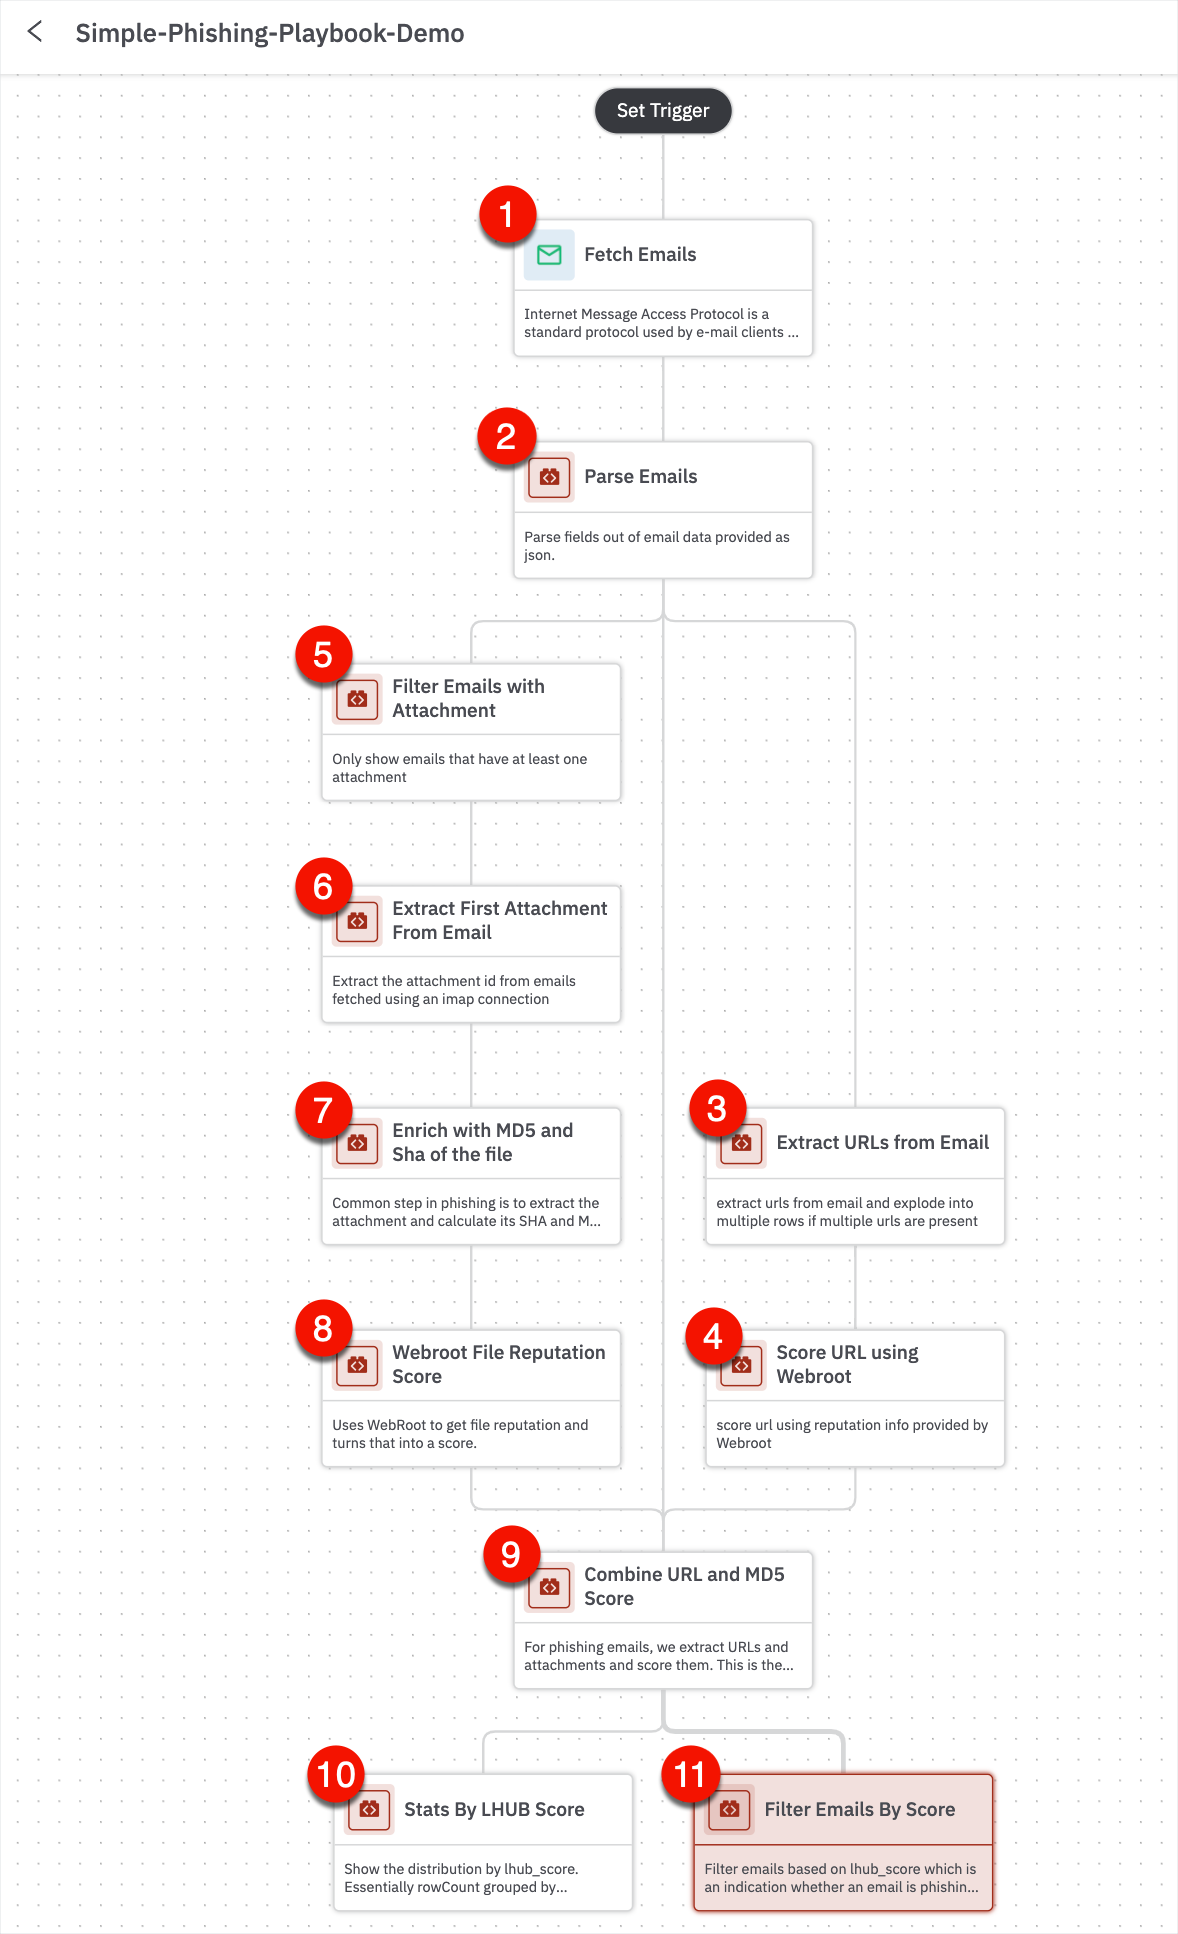
Now we have two branches, one that gives us the URL score, and the other provides the attachment with a score view.
- Combine the URL and MD5 score into one final score: the lhub score using ‘Combine URL and MD5 Score’.
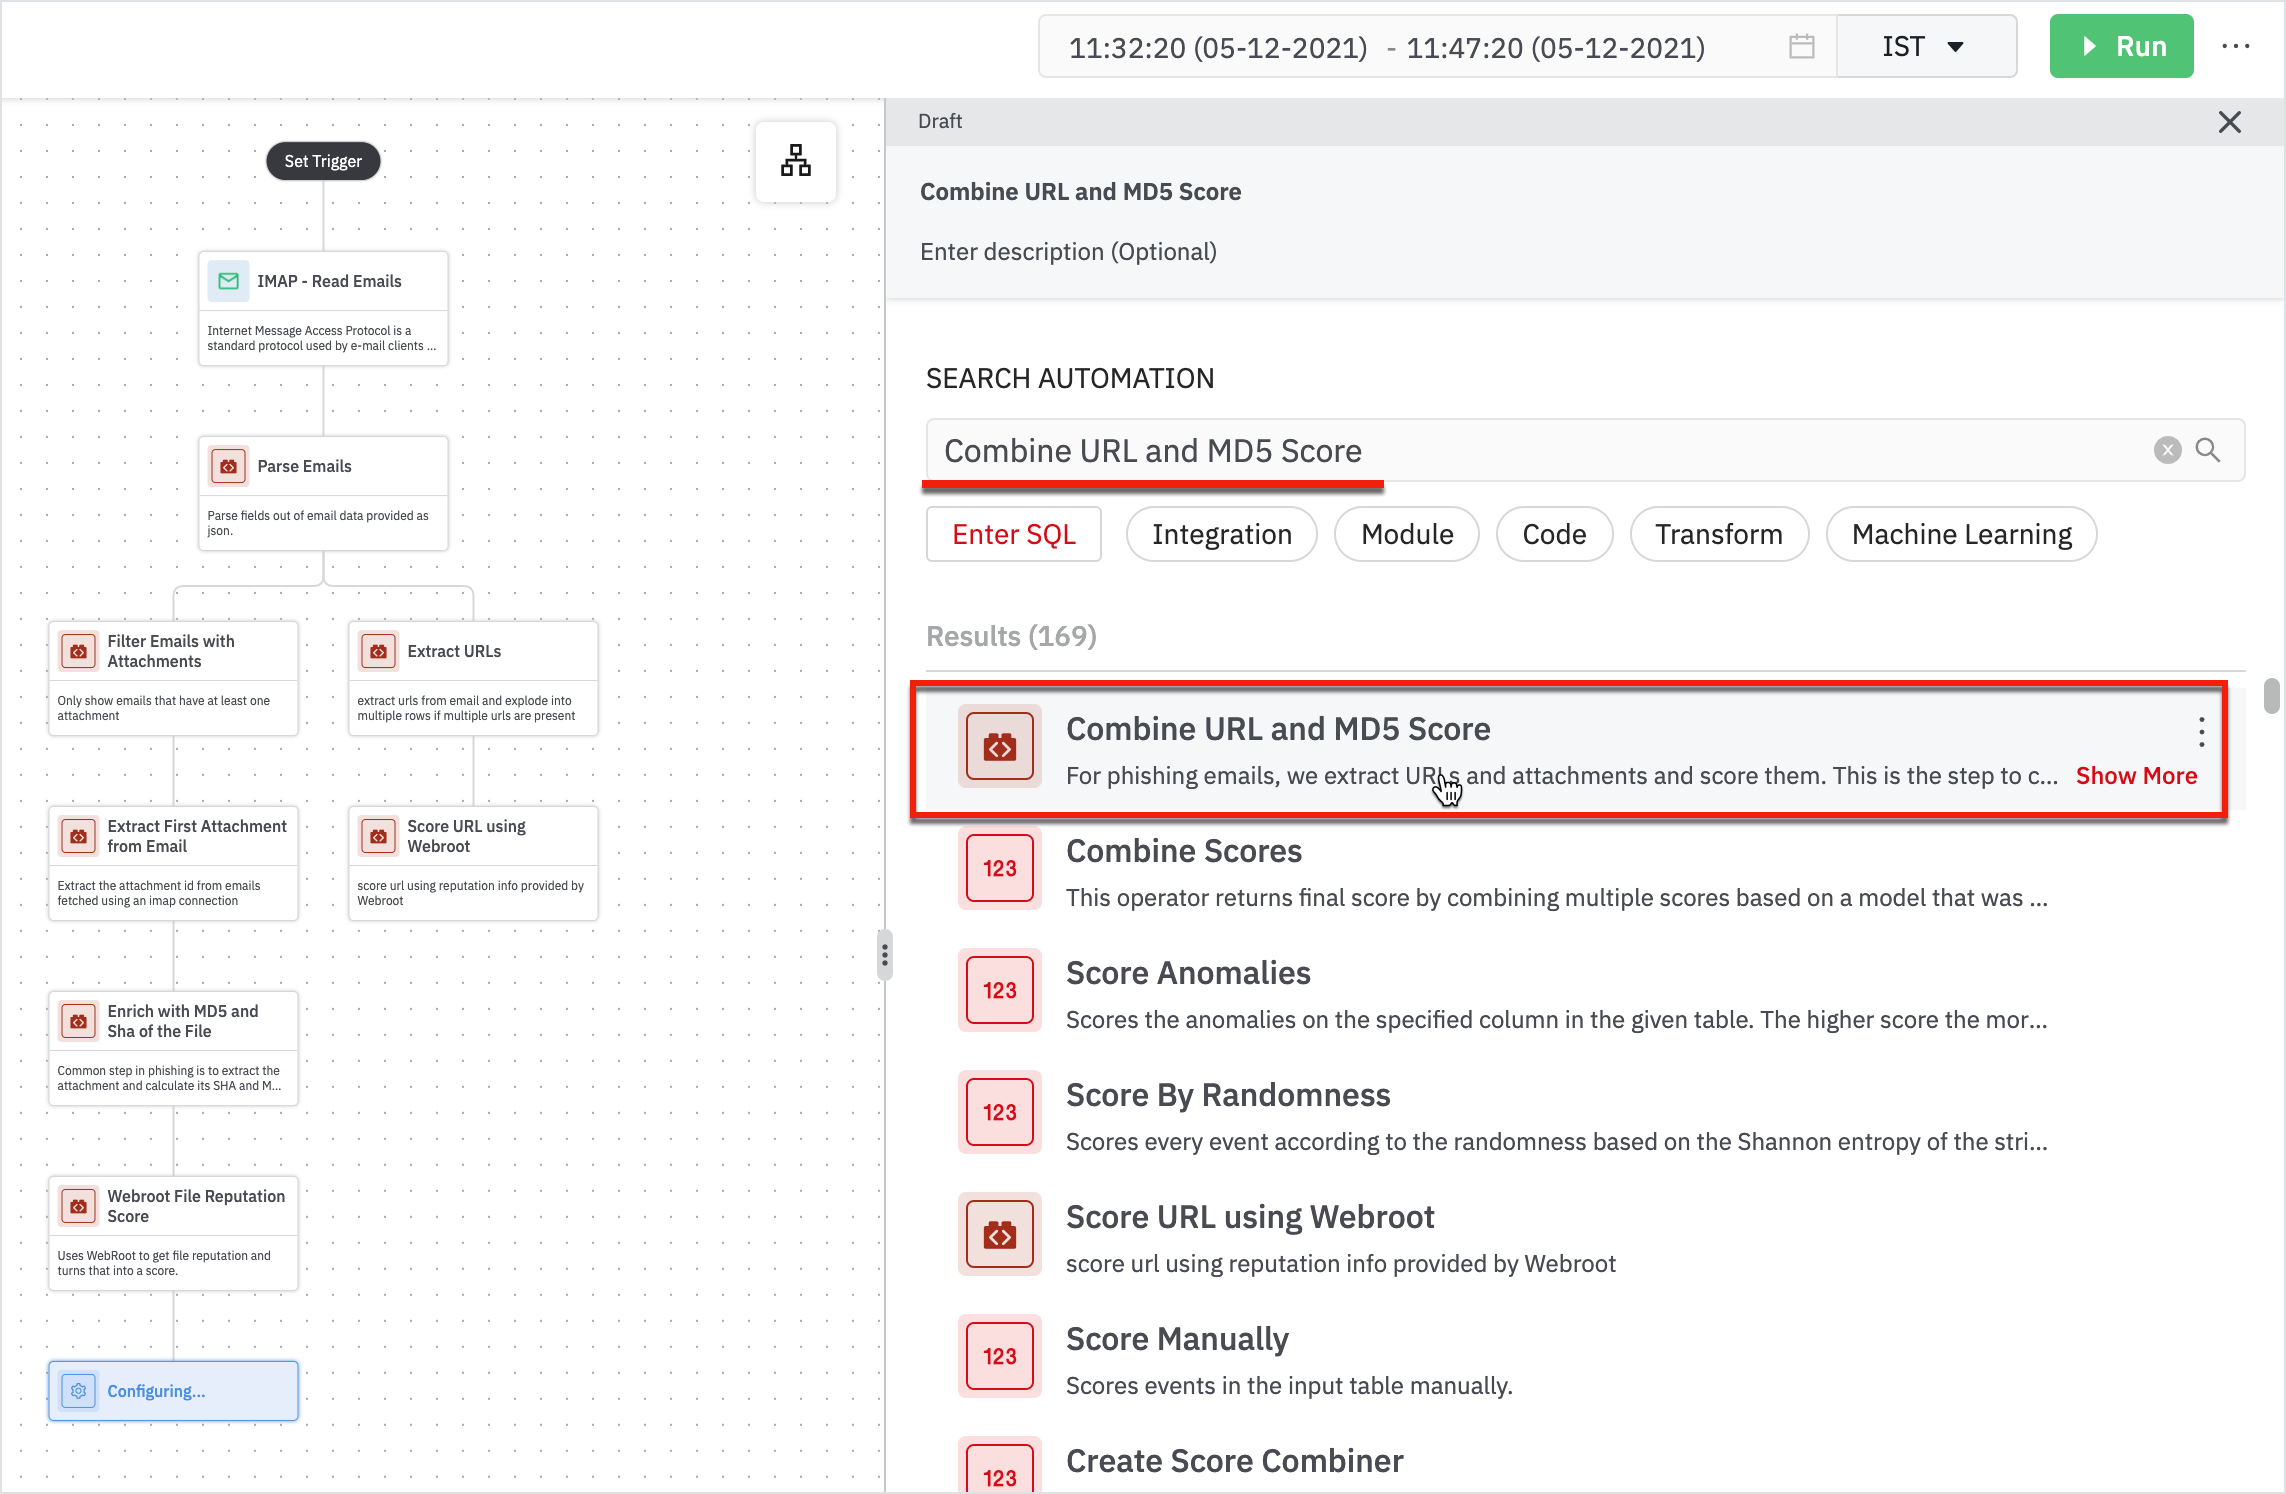
Enter the following details in the Combine URL and MD5 Score form:
- MD5 Score Table: Table containing md5 score as lhub_score.
- URL Score Table: Table containing URL score as url_score.
- Parsed Emails: Table containing parsed emails, this table must have a column called msgid which is used to stitch attachment score and URL score together.
Now, we need to see what we can do with the data that I have.
Now, you can think of filtering out the data to get the precise number of suspicious emails.
- Add ‘Stats by LHUB Score’ to see the number of suspicious or benign emails.
If the score is below 8, you can safely ignore it.
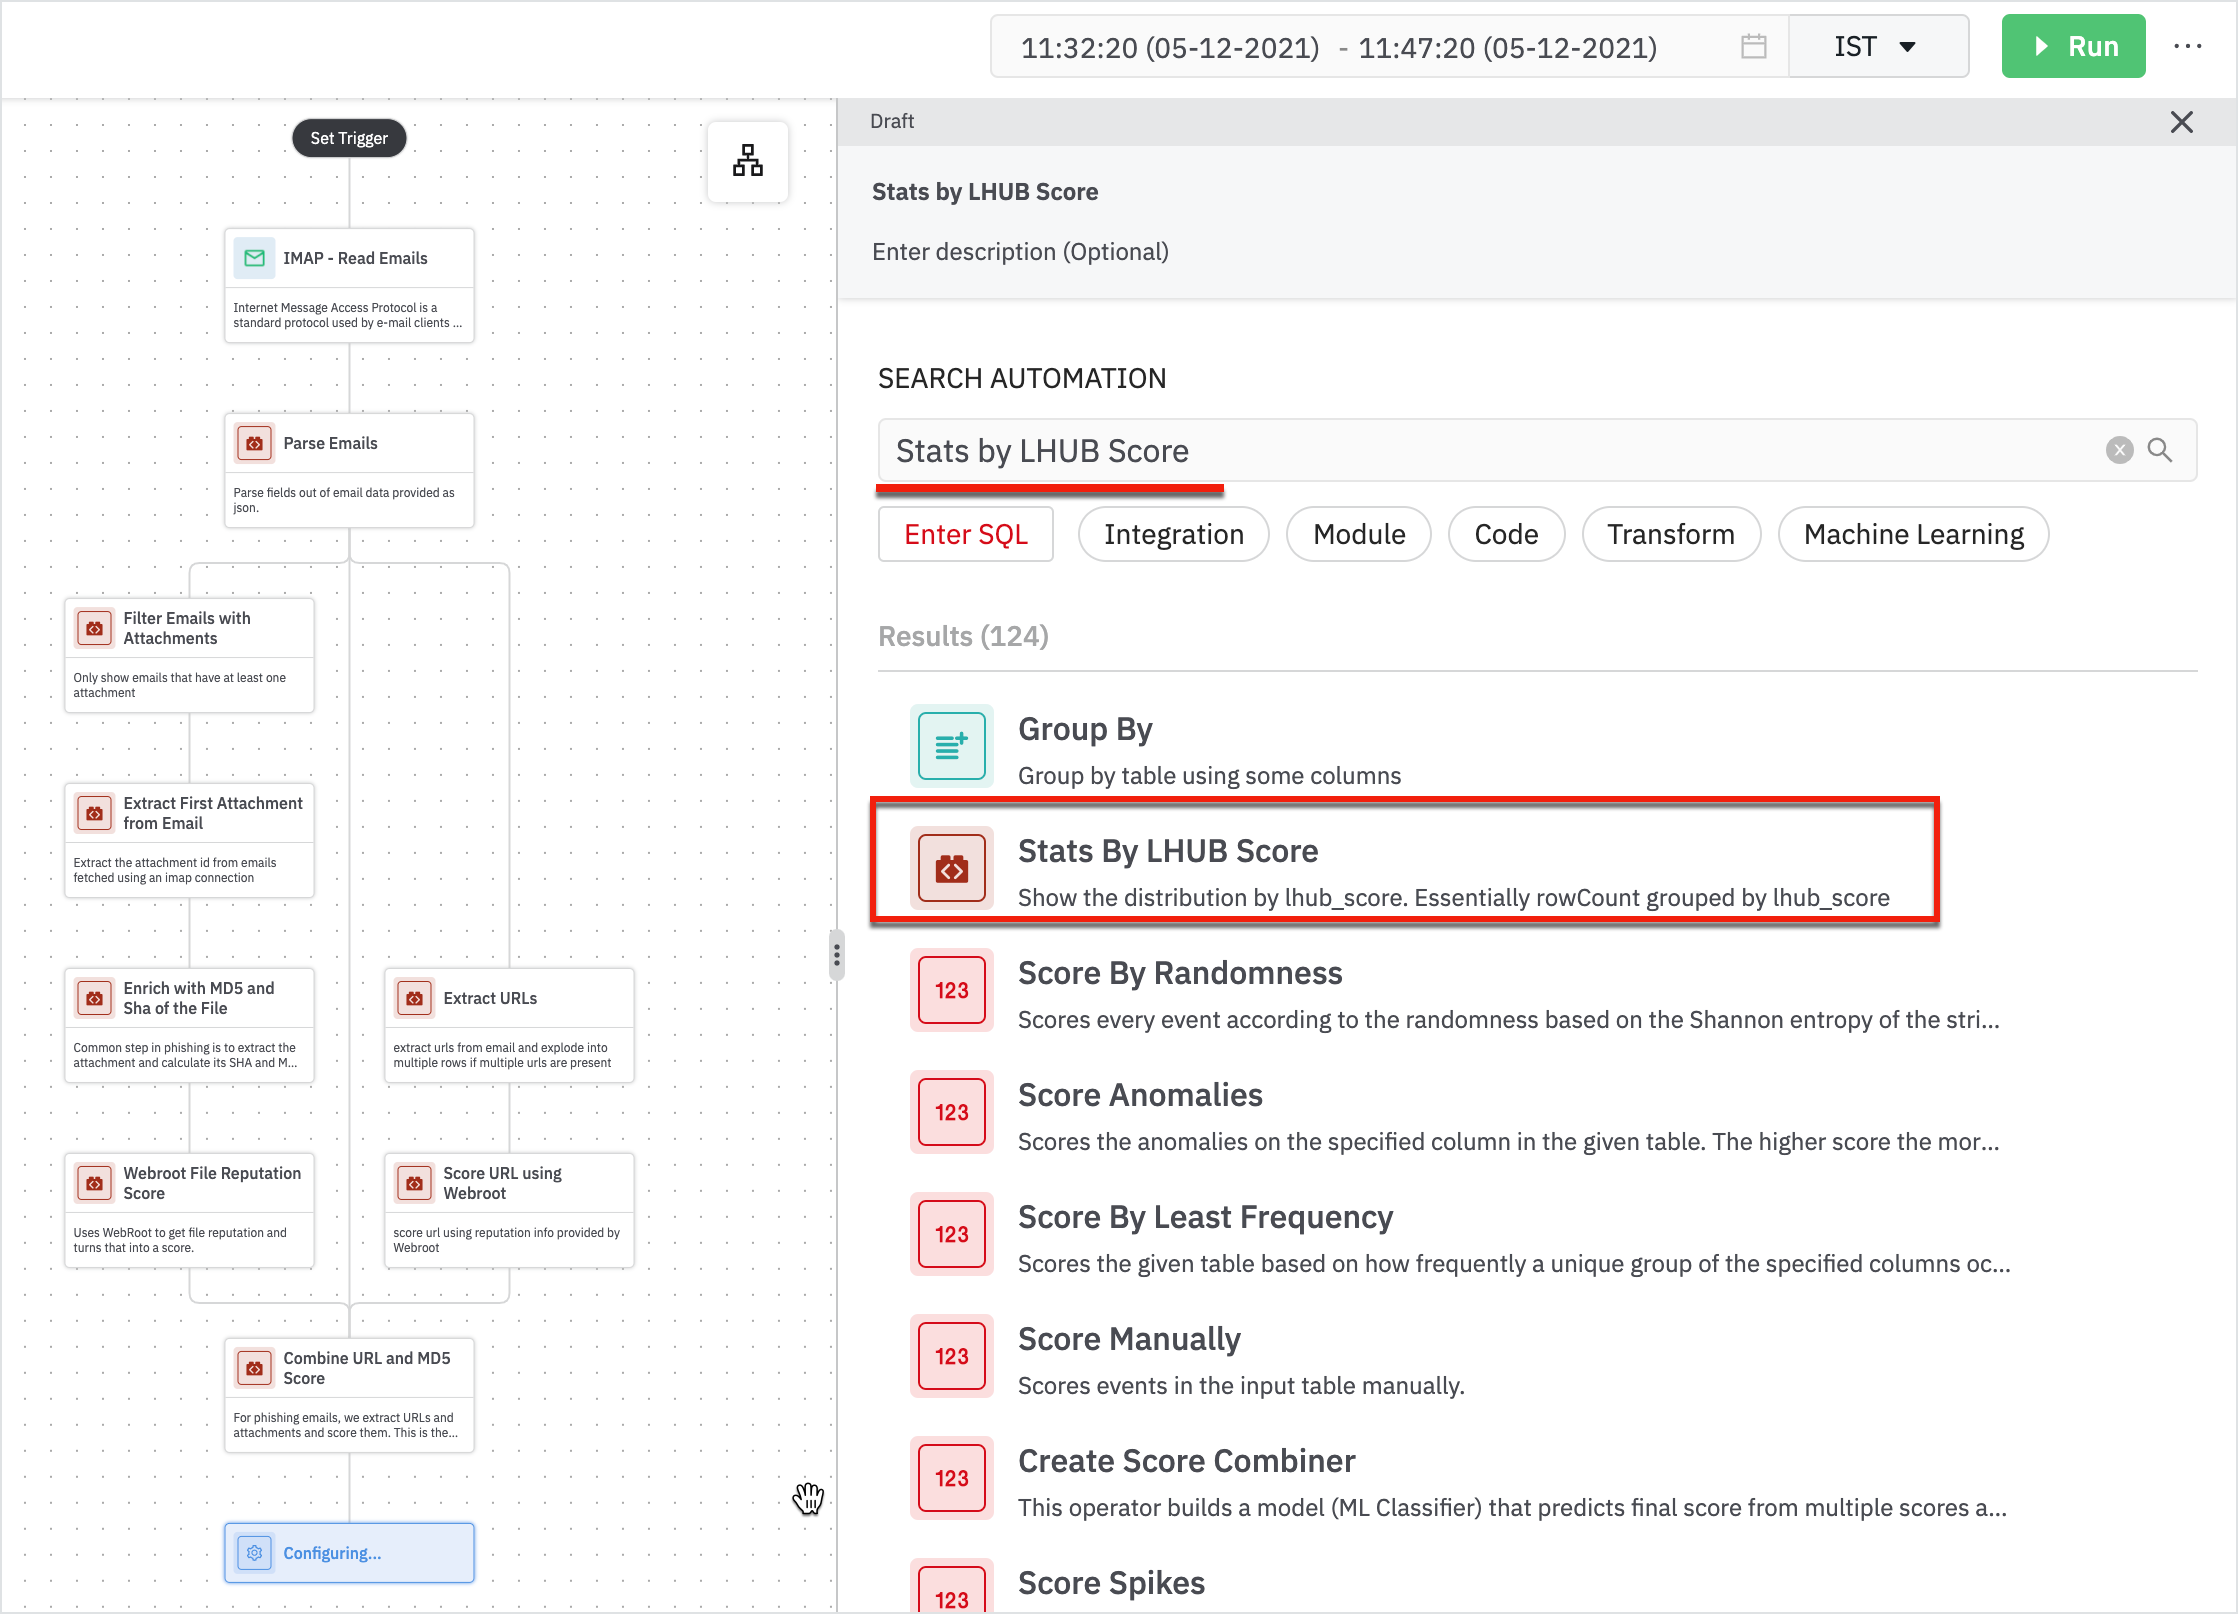
Enter the following details in the Stats by LHUB Score form:
- Parent: Parent node will be Combine URL and MD5 Score.
The result shows the number of suspicious emails.
- Add another step of filtering to get emails by score using ‘Filter Emails By Score’.
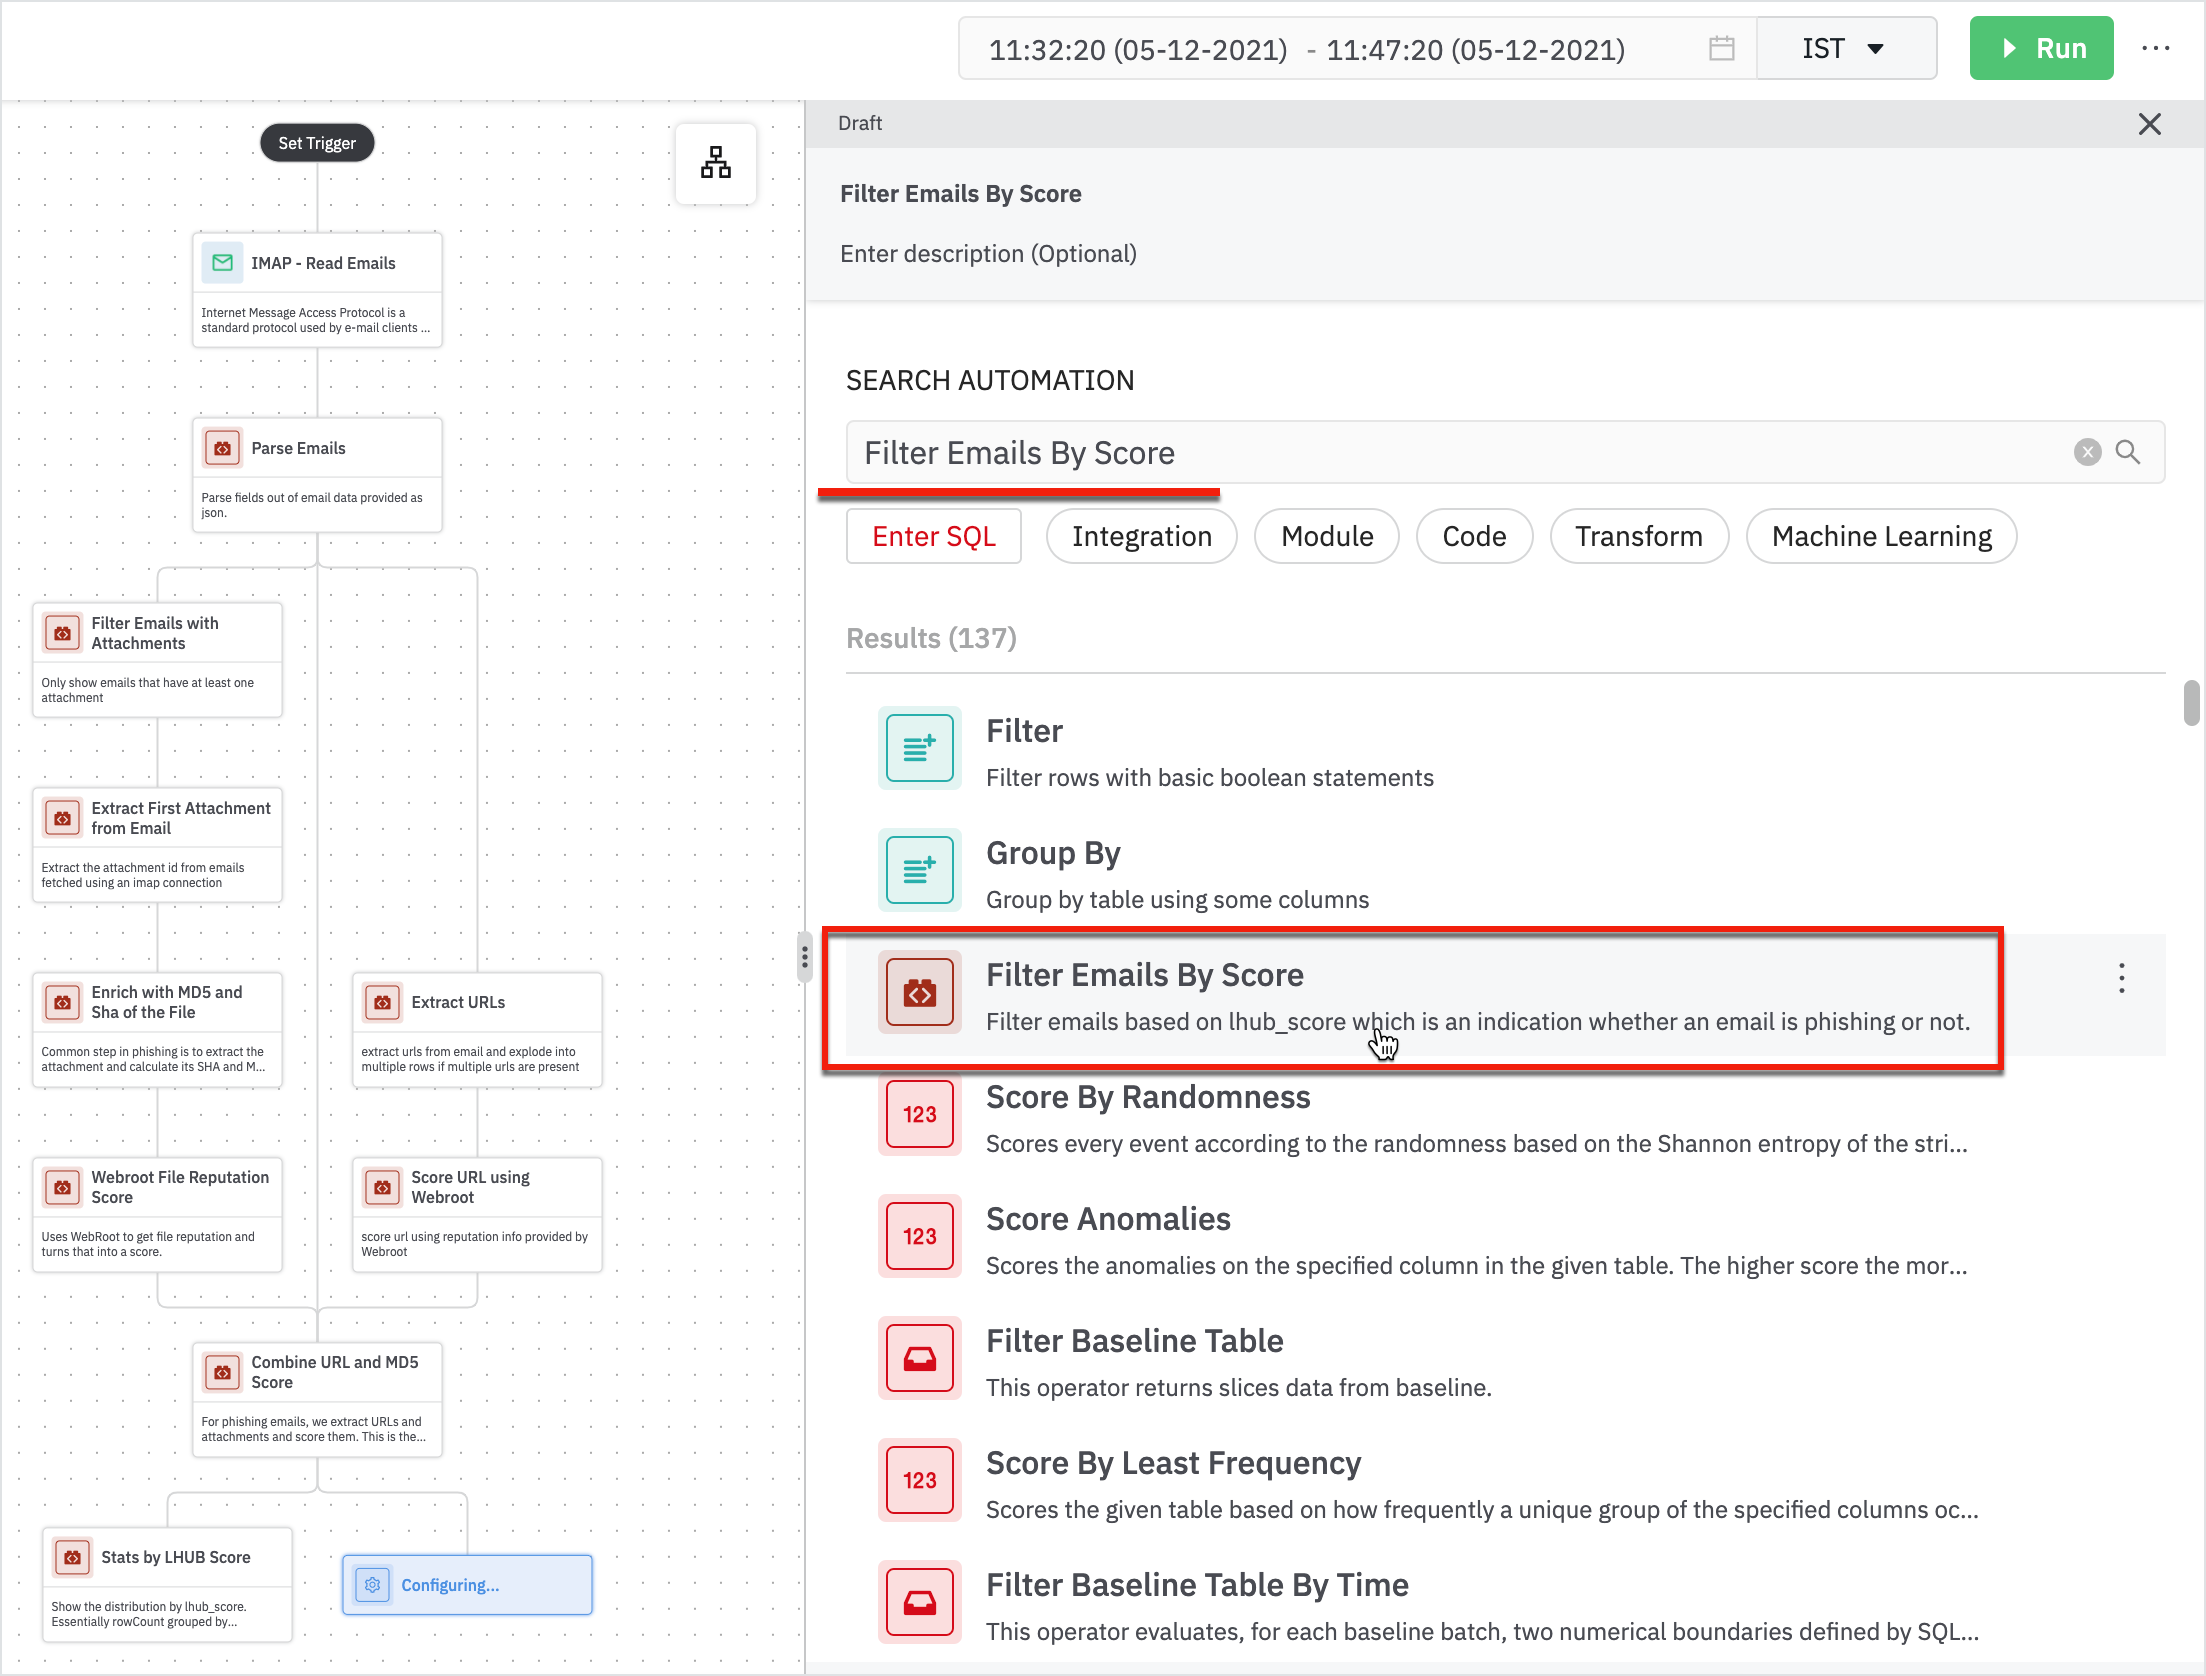
Enter the following details in the Filter Emails by Score form:
- Parent: Parent node will be Combine URL and MD5 Score.
- Score Threshold: Only return emails with a score greater than this threshold. The expected value is a number between 0-10.
The result displays a score greater than the specified threshold value.
You've Successfully Completed the Steps in Playbook
These automation steps help you to analyze a bunch of emails and filters them out down to suspicious emails.
DevoSOAR provides recommendations for every step in the playbook; you can choose to select the steps from recommendations or search for the steps to automate. You can use our extensive steps catalog to find the steps and add them to the playbook to automate.
The final phishing playbook steps look like this. This is an example of fetching the phishing email steps in the playbook.
Updated 10 months ago