Azure Monitor
Version: 2.0.0
Azure Monitor maximizes the availability and performance of your applications and services by delivering a comprehensive solution for collecting, analyzing, and acting on telemetry from your cloud and on-premises environments.
Connect Azure Monitor with LogicHub
- Navigate to Automations > Integrations.
- Search for Azure Monitor.
- Click Details, then the + icon. Enter the required information in the following fields.
- Label: Enter a connection name.
- Reference Values: Define variables here to templatize integration connections and actions. For example, you can use https://www.{{hostname}}.com where, hostname is a variable defined in this input. For more information on how to add data, see 'Add Data' Input Type for Integrations.
- Verify SSL: Select option to verify connecting server's SSL certificate (Default is Verify SSL Certificate).
- Remote Agent: Run this integration using the LogicHub Remote Agent.
- Cloud _environment: environment to which connection has to be made.
- There are four cloud environments (AZURE_PUBLIC_CLOUD, AZURE_CHINA_CLOUD, AZURE_US_GOV_CLOUD, AZURE_GERMAN_CLOUD). AZURE_PUBLIC_CLOUD is the default cloud environment.
- Client_id: Application Client ID.
- Password: Service principal password.
- Azure Tenant_id: Directory ID of the application.
- After you've entered all the details, click Connect.
Actions for Azure Compute
Get Activity Log
Get activity log from resource/resource Group.
Input Field
Choose a connection that you have previously created and then fill in the necessary information in the following input fields to complete the connection.
| Input Name | Description | Required |
|---|---|---|
| Subscriber Id Column Name | Column name from parent table to lookup value for subscriber ID. | Required |
| Filter String Column name | Column name from the parent table to lookup value for the string on basis of which logs will be filtered. | Required |
Output
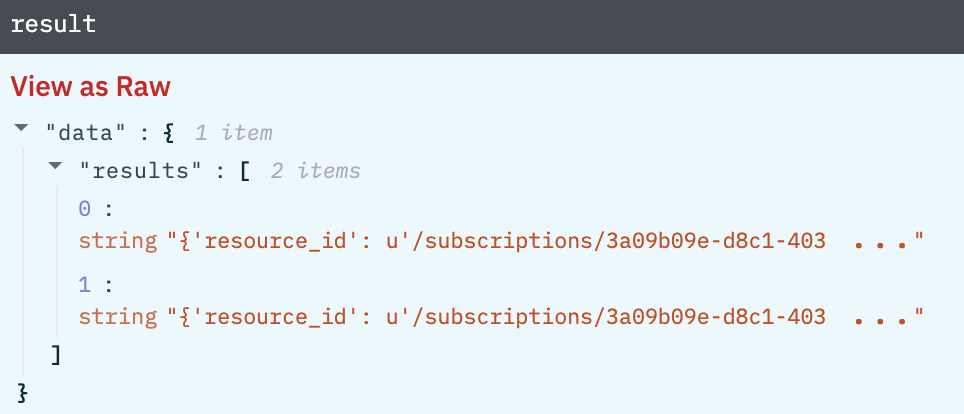
List of dict. where each dict depicts one log entry. Sometimes, objects also come as a value of the dictionary as the level of nesting is not defined in logs.

Get Resource Metric
Get a metric for the resource.
Input Field
Choose a connection that you have previously created and then fill in the necessary information in the following input fields to complete the connection.
| Input Name | Description | Required |
|---|---|---|
| Subscriber Column Name | Column name from parent table to lookup value for subscriber ID. | Required |
| Filter String Column Name | Column name from the parent table to lookup value for the string on basis of which logs will be filtered. | Required |
| Resource URL Column name | Column name from the parent table to lookup value for resource URL. | Required |
Output
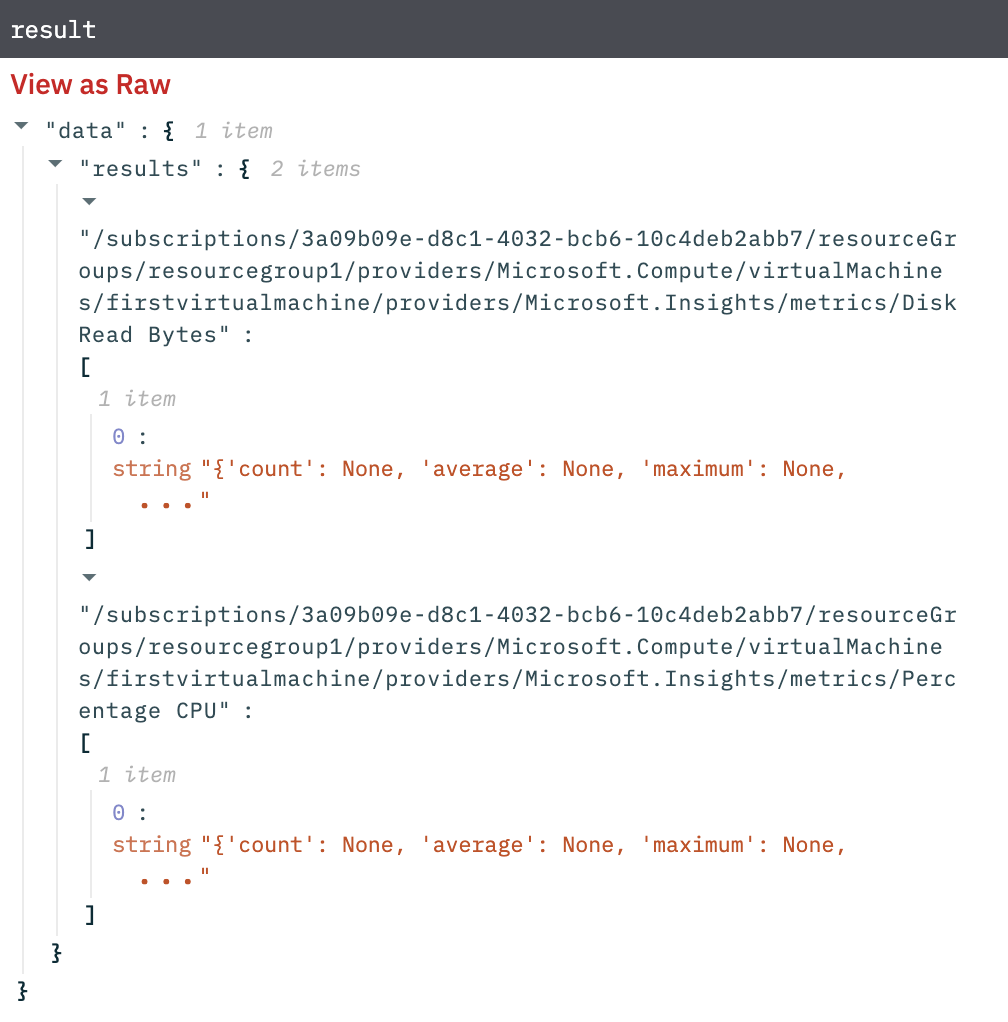
A list of dict. key of the dict will be metric_name and the value of the dict will be a list that will contain the metric_value at a different point in time.

Release Notes
v2.0.0- Updated architecture to support IO via filesystem
Updated over 2 years ago